Dieser Beitrag ist auch verfügbar auf:
I never thought you could suprise me in the field of HRV measurement. But a small Czech manufacturer has now totally turned my world upside down!
Sponsored Post: mySASY provided me with free access for this test. This had no influence on the content of my post. The article is written indipendently and reflects exclusively my personal experiences.
Inhalt / Content
Managing training with heart rate variability (HRV)
I have been measuring my resting heart rate and heart rate variability every morning for five years. It all started with the Vitalmonitor Pro, but I have now tested almost all the popular apps and systems – right up to the Oura Ring. I have also used systems in parallel over long periods of time. So I have a little experience in the field. ;)
I certainly wouldn’t have kept up the morning measurements for so long if they didn’t offer me a real advantage. And for me, that is primarily the standardised statement about my body’s state of recovery. You can’t always just deduce this from training, because all the everyday stressors also play a role: Work, arguments, health, travel, …
From my morning recovery value, I can therefore tell whether my body could handle a strong training stimulus today, whether I would rather reduce the intensity or even stay at home altogether. From the long-term trends I can see whether I am basically coping well with the current training plan or whether I am overstraining myself with it.
RMSSD – the “recovery” value
All the systems I have tested so far relate their statements to the different lengths of the intervals between two heartbeats (time-domain). In particular, the RMSSD (Root mean square of successive RR interval differences) is usually the decisive metric here. The main reason for this is that it has established itself as the standard measure for parasympathetic heart regulation, i.e. for regeneration and recovery of the body – and it is relatively easy to determine. A chest strap, an app and two minutes of time are all it takes.
In the autonomic nervous system, however, the parasympathetic nervous system also has a counterpart: the sympathetic nervous system. The sympathetic nervous system is not responsible for rest and recovery, but for flight and fight – or let’s say: for the activation of the body and the mobilisation of resources. Its activity can be measured just as easily as that of the parasympathetic nervous system, but the time required for this is significantly higher (frequency domain): for reasonably accurate results, the measurement should take at least 15 minutes or even up to an hour!
Why am I telling you all this? Because it was only through mySASY that I really got involved with the sympathetic nervous system and I was not aware that I was actually only looking at one half of the equation with my HRV measurements.
ReviewmySASY
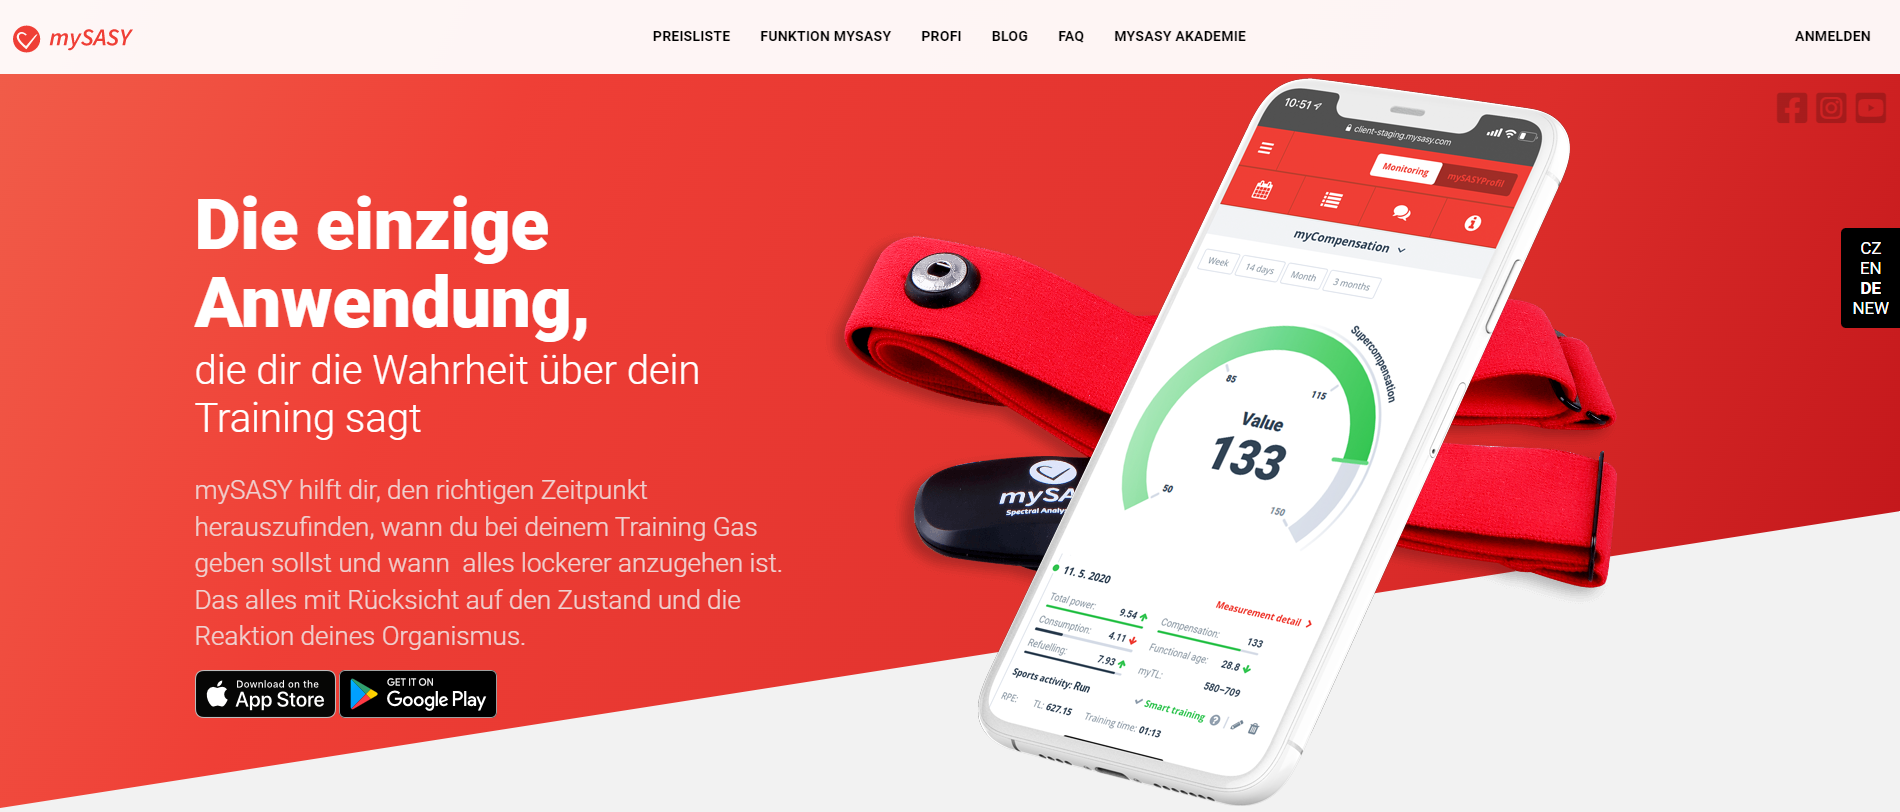
mySASY – Scientific expertise from the Czech Republic
To be honest: I had not noticed mySASY at all. This may be mainly because it is a Czech company that, after successes in its own country, is only now venturing across the borders. The minds behind it clearly show the scientific claim of the company: there is a doctor of exercise physiology, an engineer of technical cybernetics / biocybernetics, sports scientists and of course clever programmers.
Together, they have been working on the spectral analysis of heart rate variability for a long time – especially as applied to the training of recreational to competitive athletes. Their special approach includes the assessment of both components of the autonomic nervous system: parasympathetic and sympathetic.
Special feature of the measurement
mySASY uses a rather scientific protocol: the measurement is not taken over a certain period of time, but for exactly 187 heartbeats. In addition, there is a change of position: after 22 beats while lying down, 55 are measured while standing and then 110 beats are measured again while lying down. If you have paid attention, you will notice that the resulting measurement of approx. 4 minutes is actually not sufficient to make valid statements about the activity of the sympathetic nervous system.
The original (and still available) method therefore also provides for a measurement over 15 minutes (840 heartbeats). But the team has succeeded through machine learning (artificial intelligence) in coming to the same conclusions in only about 4 minutes or 187 heartbeats. This was the technical breakthrough that made the system suddenly attractive to me.
As far as I know, this is the only system that can provide information on both dimensions of the autonomic nervous system in such a short time – and also uses the informational value of an orthostatic test. In principle, this is also available from the manufacturer Polar, but there it only leads to statements about the activity of the parasympathetic nervous system.
Daily measurement via the app
In everyday practice, the measurement is done very simply via an app (Android or iOS) and a chest strap. Ideally, you use a Polar H10 or the model offered by mySASY itself. Getting started with mySASY is no big hurdle either: you can use the system free of charge for the first 14 days. After that, you have to pay five euros per month (if you pay annually).
Of course, you first have to create an account with mySASY, enter some personal data, pair your chest strap and can also connect to other services like Strava. Then you look for a suitable time slot in your morning routine to integrate the measurement firmly into your daily schedule. Since measurements are taken while lying or standing, you should choose a place where you can lie down on a bed or sofa.
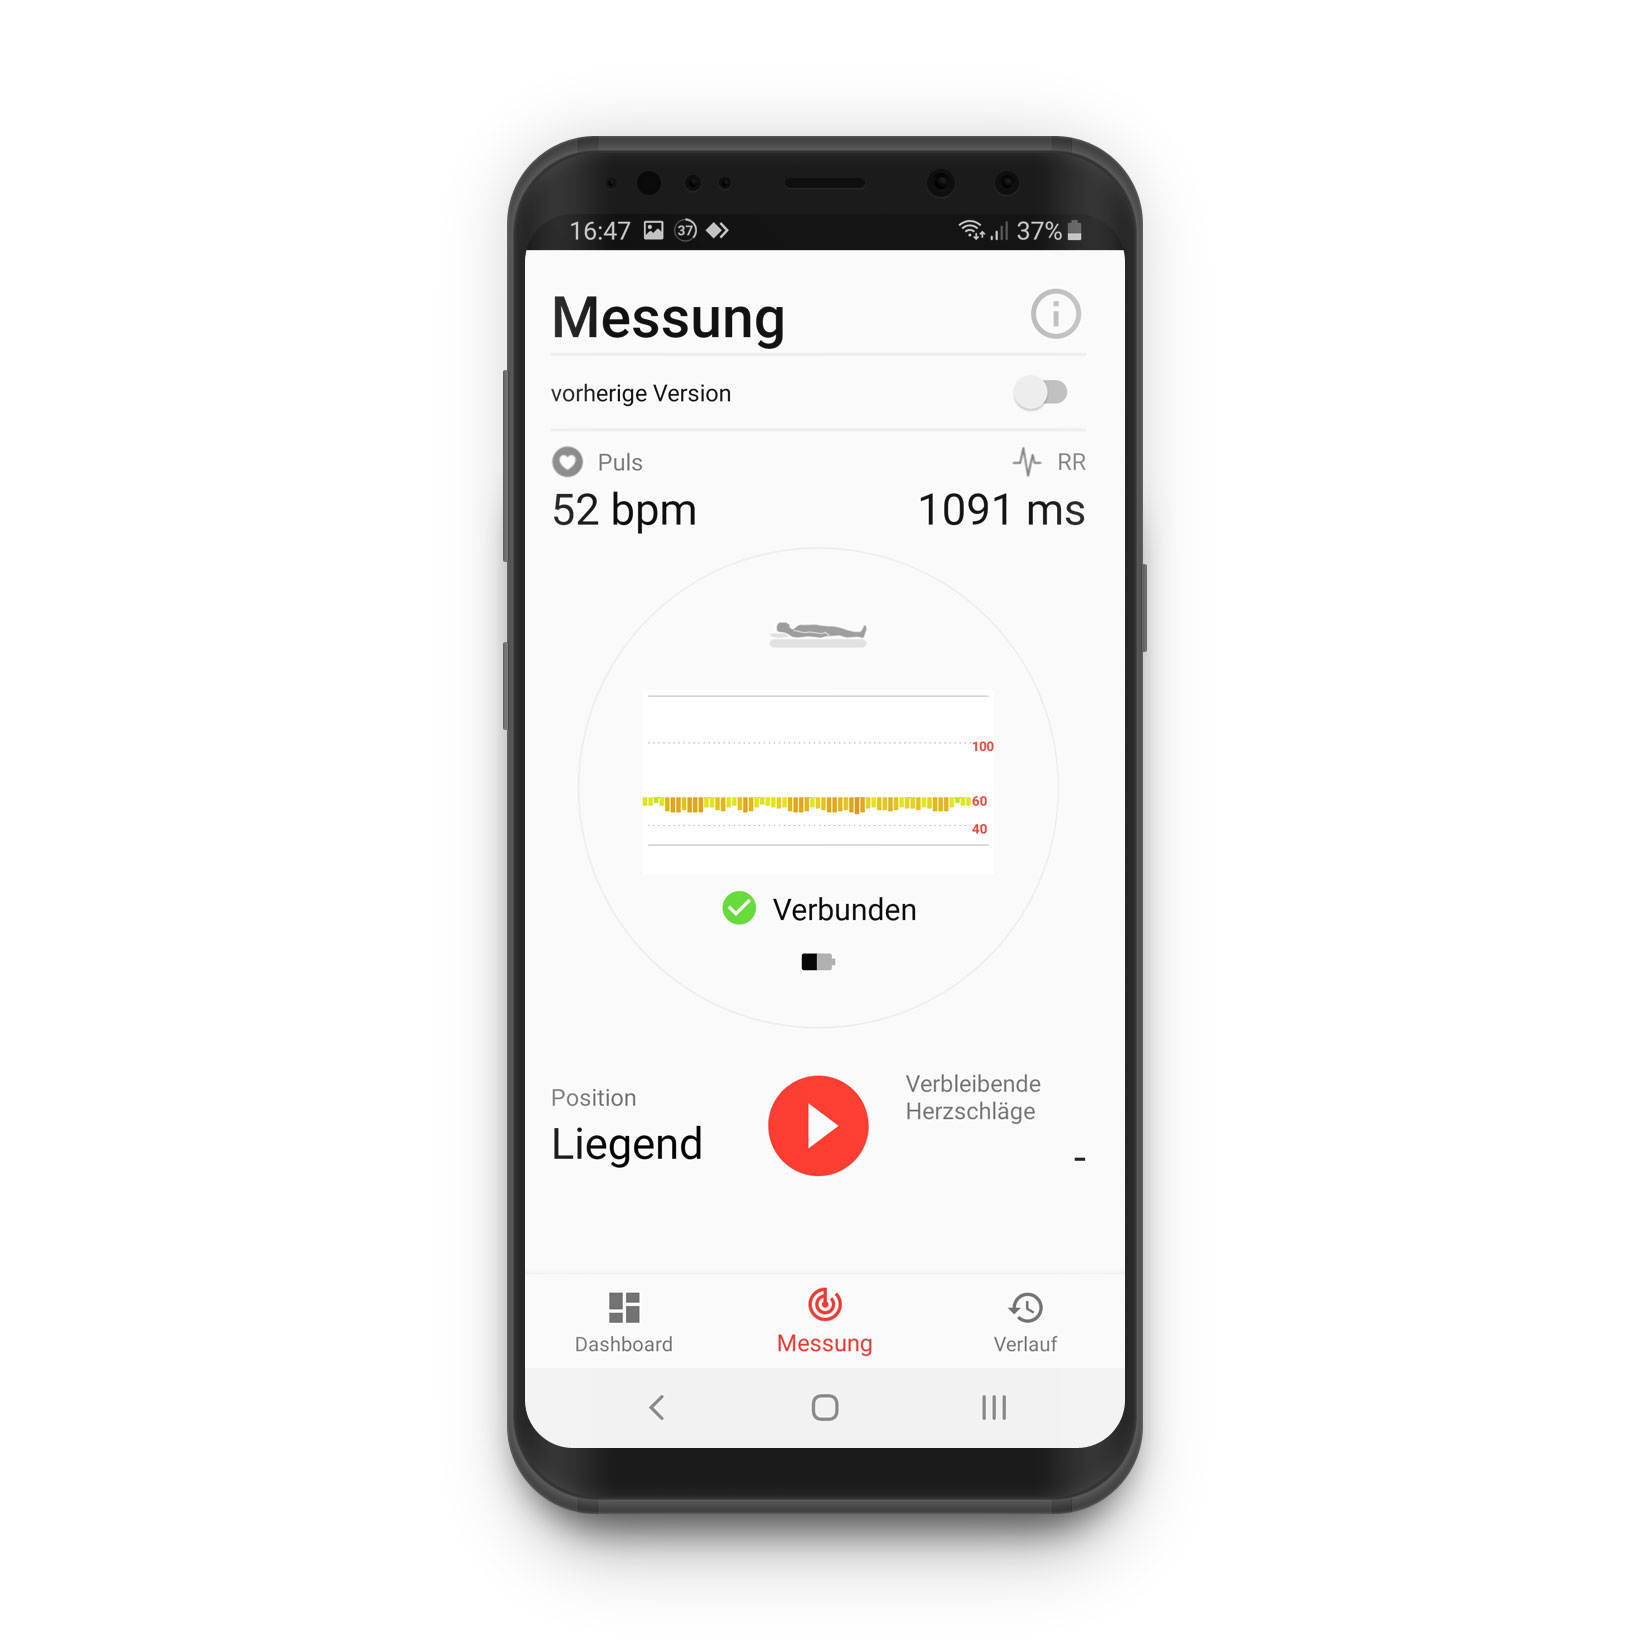
The app then guides you through the measurement process. You are clearly reminded of the change of positions by a signal tone – in addition, the current position is also displayed as a picture and a text. You always have your current heart rate in view, as well as the remaining heartbeats until the next change or the end of the measurement.
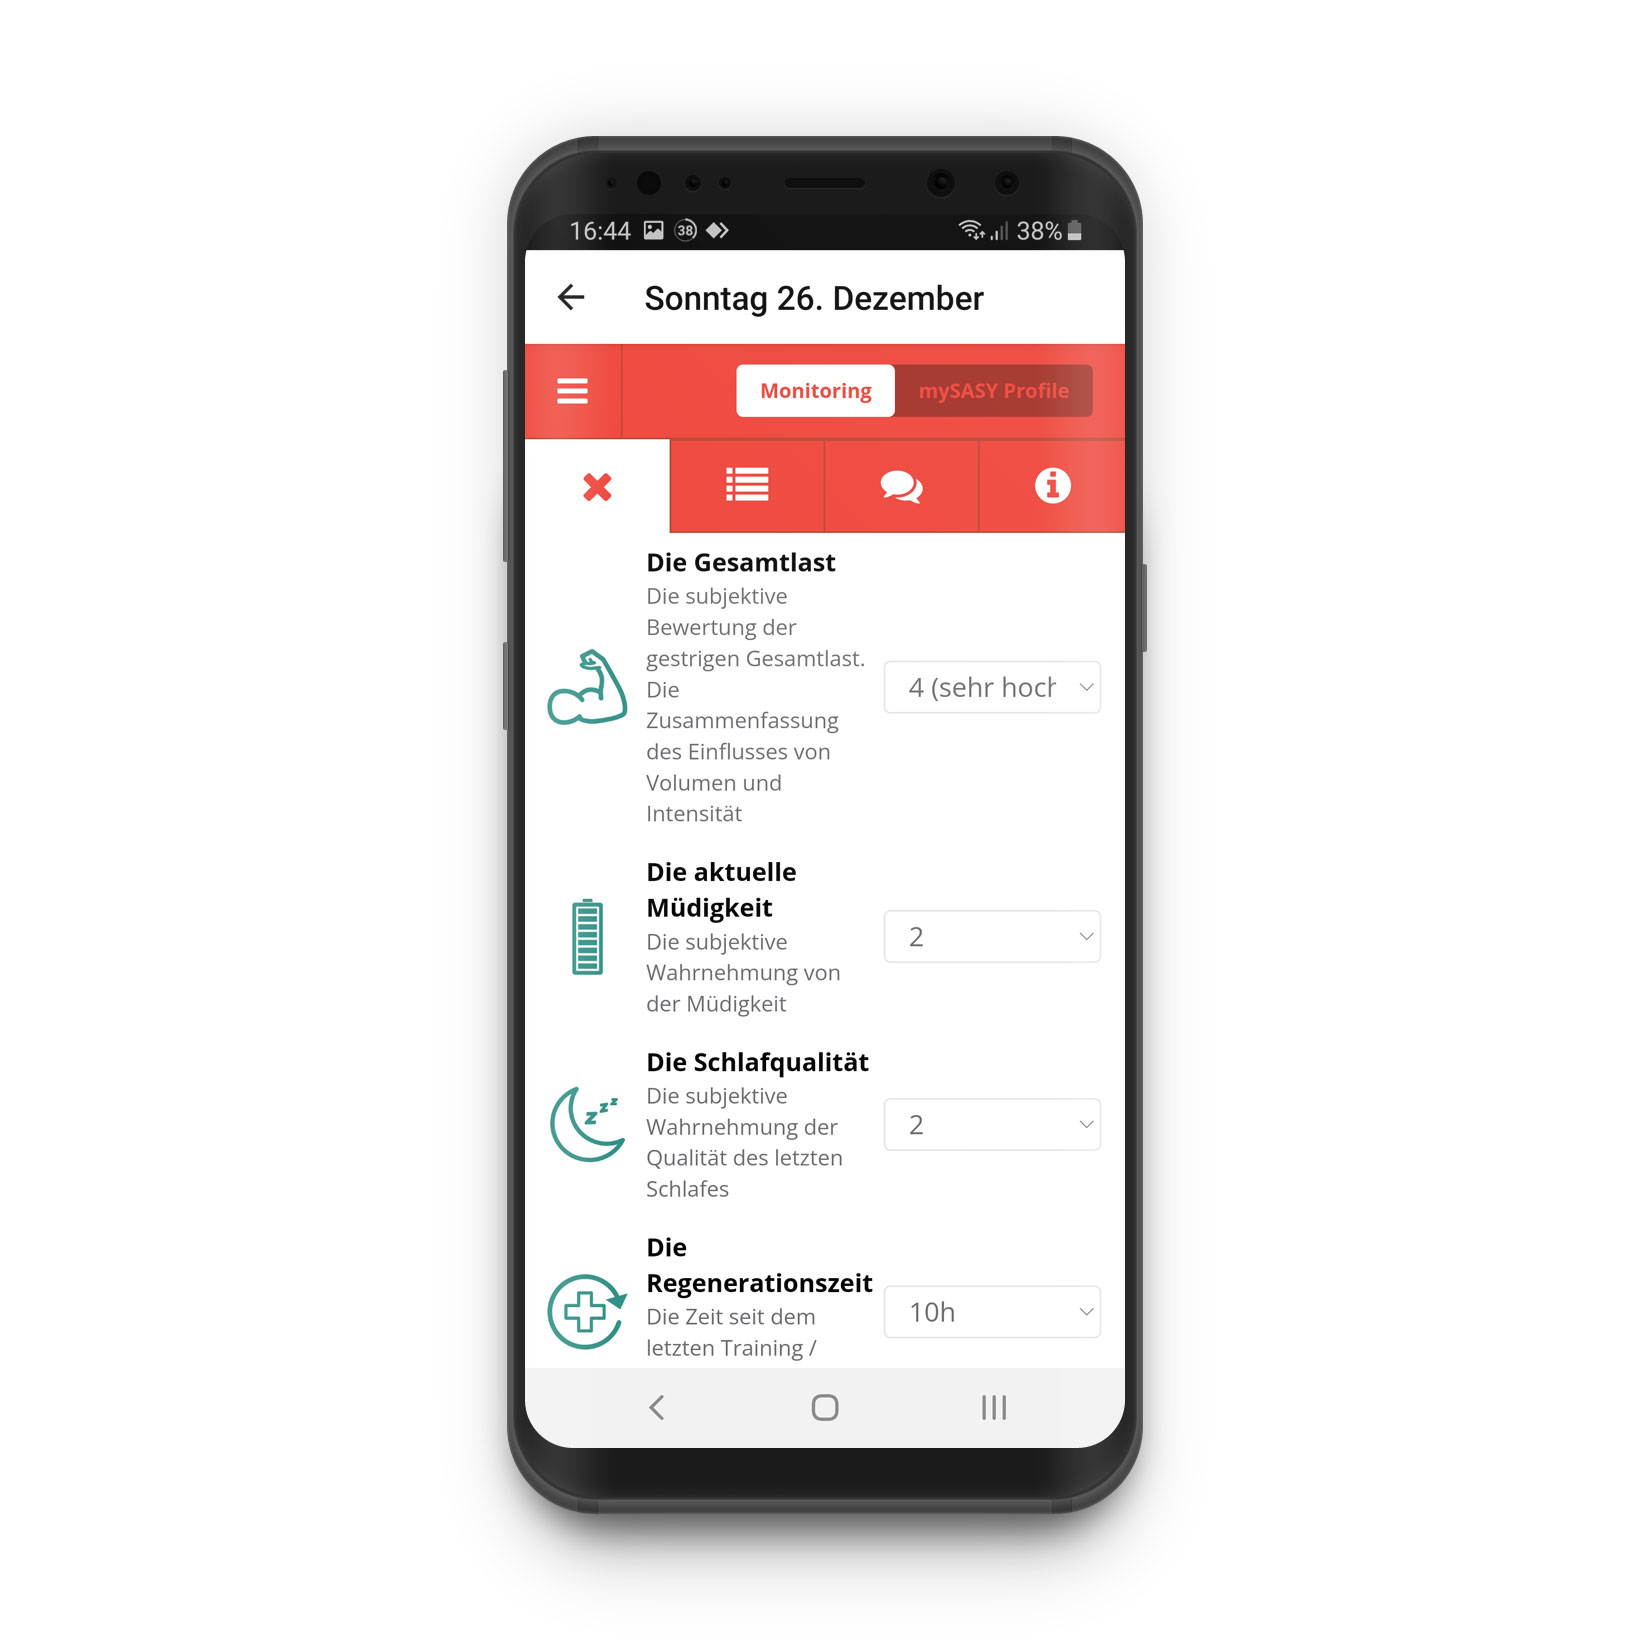
The recording is supplemented by a questionnaire that records the subjective assessment of training load, muscle fatigue, sleep quality, health and stress. This information is not only to be seen as an entry in the training diary, but also forms an important basis for further evaluation.
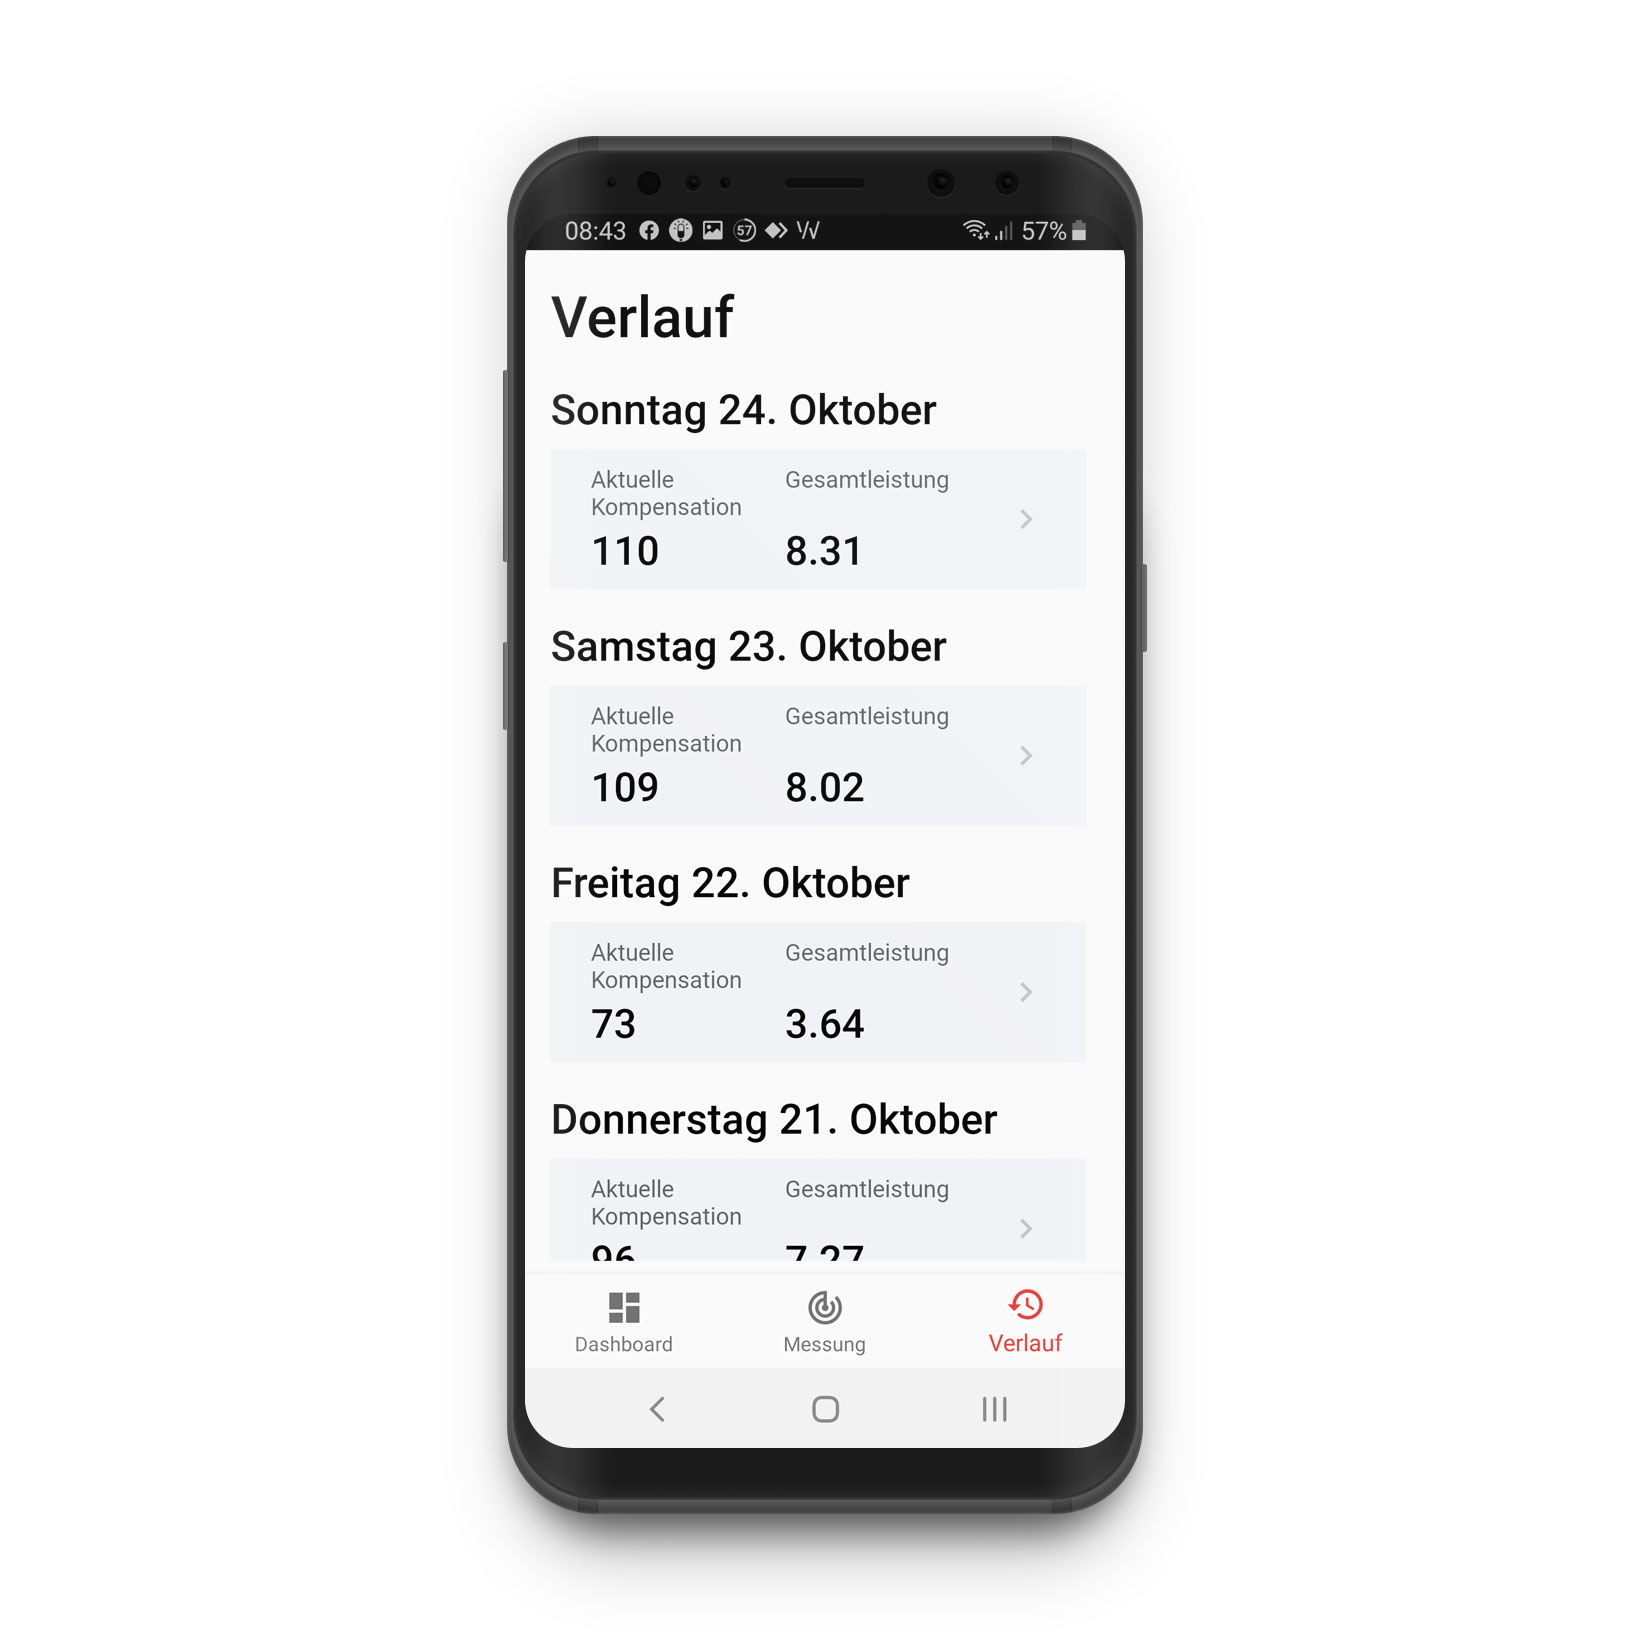
The result can then be seen in the protocol. The evaluation and detailed written assessment focuses primarily on the “compensation value” – however, many more metrics are determined.
In practice
As with all HRV measurements, it is very important to always create the same conditions. For example, I always measure directly after my morning toilet on the sofa. When switching to the measurement in the app, you get your heart rate displayed before you start. Here I always wait until the values no longer change quickly – this usually takes one to two minutes.
I had originally started the measurement lying on the floor, but that is not really ideal. The physical effort to get from lying to standing (and then back) is clearly visible in the progression. A bed or a sofa work much better for me.
Basically, I have to say that the four minutes don’t feel that long. The change of positions makes it feel much shorter to me.
Web-Client
Even though all results can be viewed via the app, the display in the web client is much more convenient. Here you are always offered extensive help functions.
3D-Graph
There is no way to view the daily measurement again later – apart from the derived metrics of course. Unless you use the original long measurement method over 840 heartbeats.
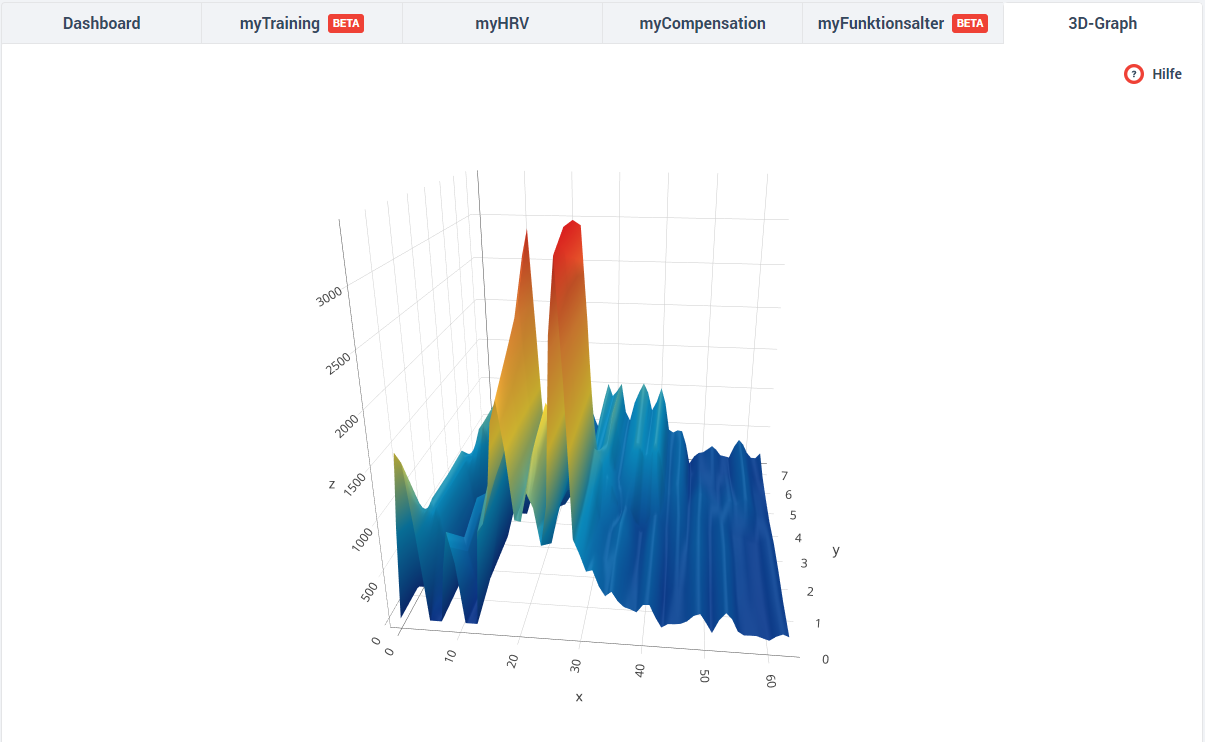
This measurement, which takes about 15 minutes, produces a three-dimensional graph that can be viewed in the web client at any time. In addition, mySASY provides a whole 69 determined metrics resulting from the analysis of the measurement series.
In practice
It is very welcome that mySASY continues to offer this long (and probably scientifically more accurate) method as a choice. I have not made any comparative measurements to see whether there are differences between the old and the new measurement method. Because two measurements directly one after the other never come to the same result.
Also, I have to say that 15 minutes is really long…. The four minutes of the short measurement are certainly well invested, but I have honestly only tried the long one once.
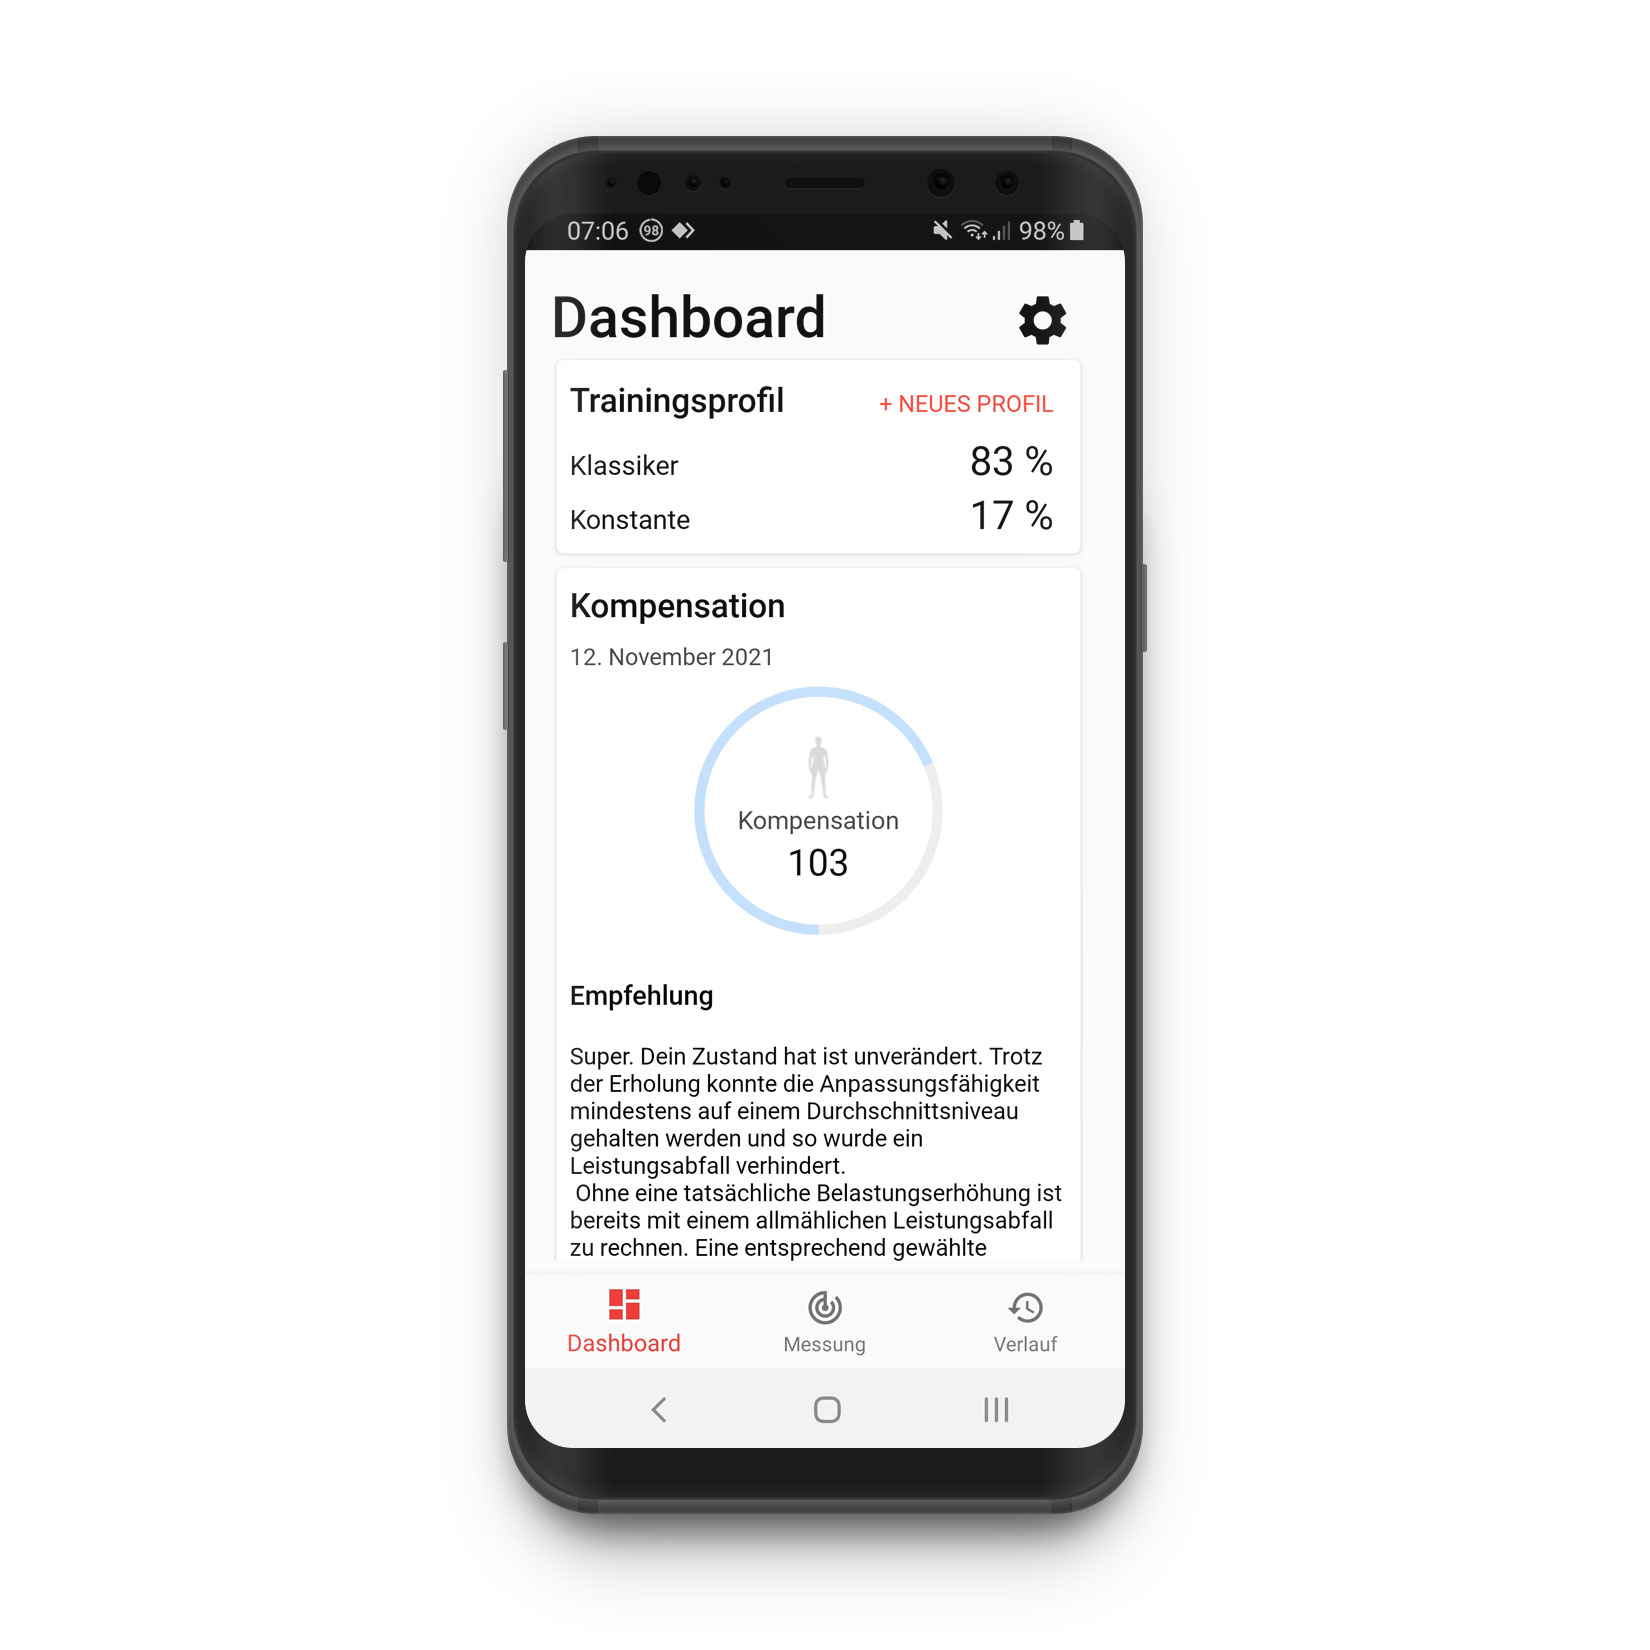
myCompensation
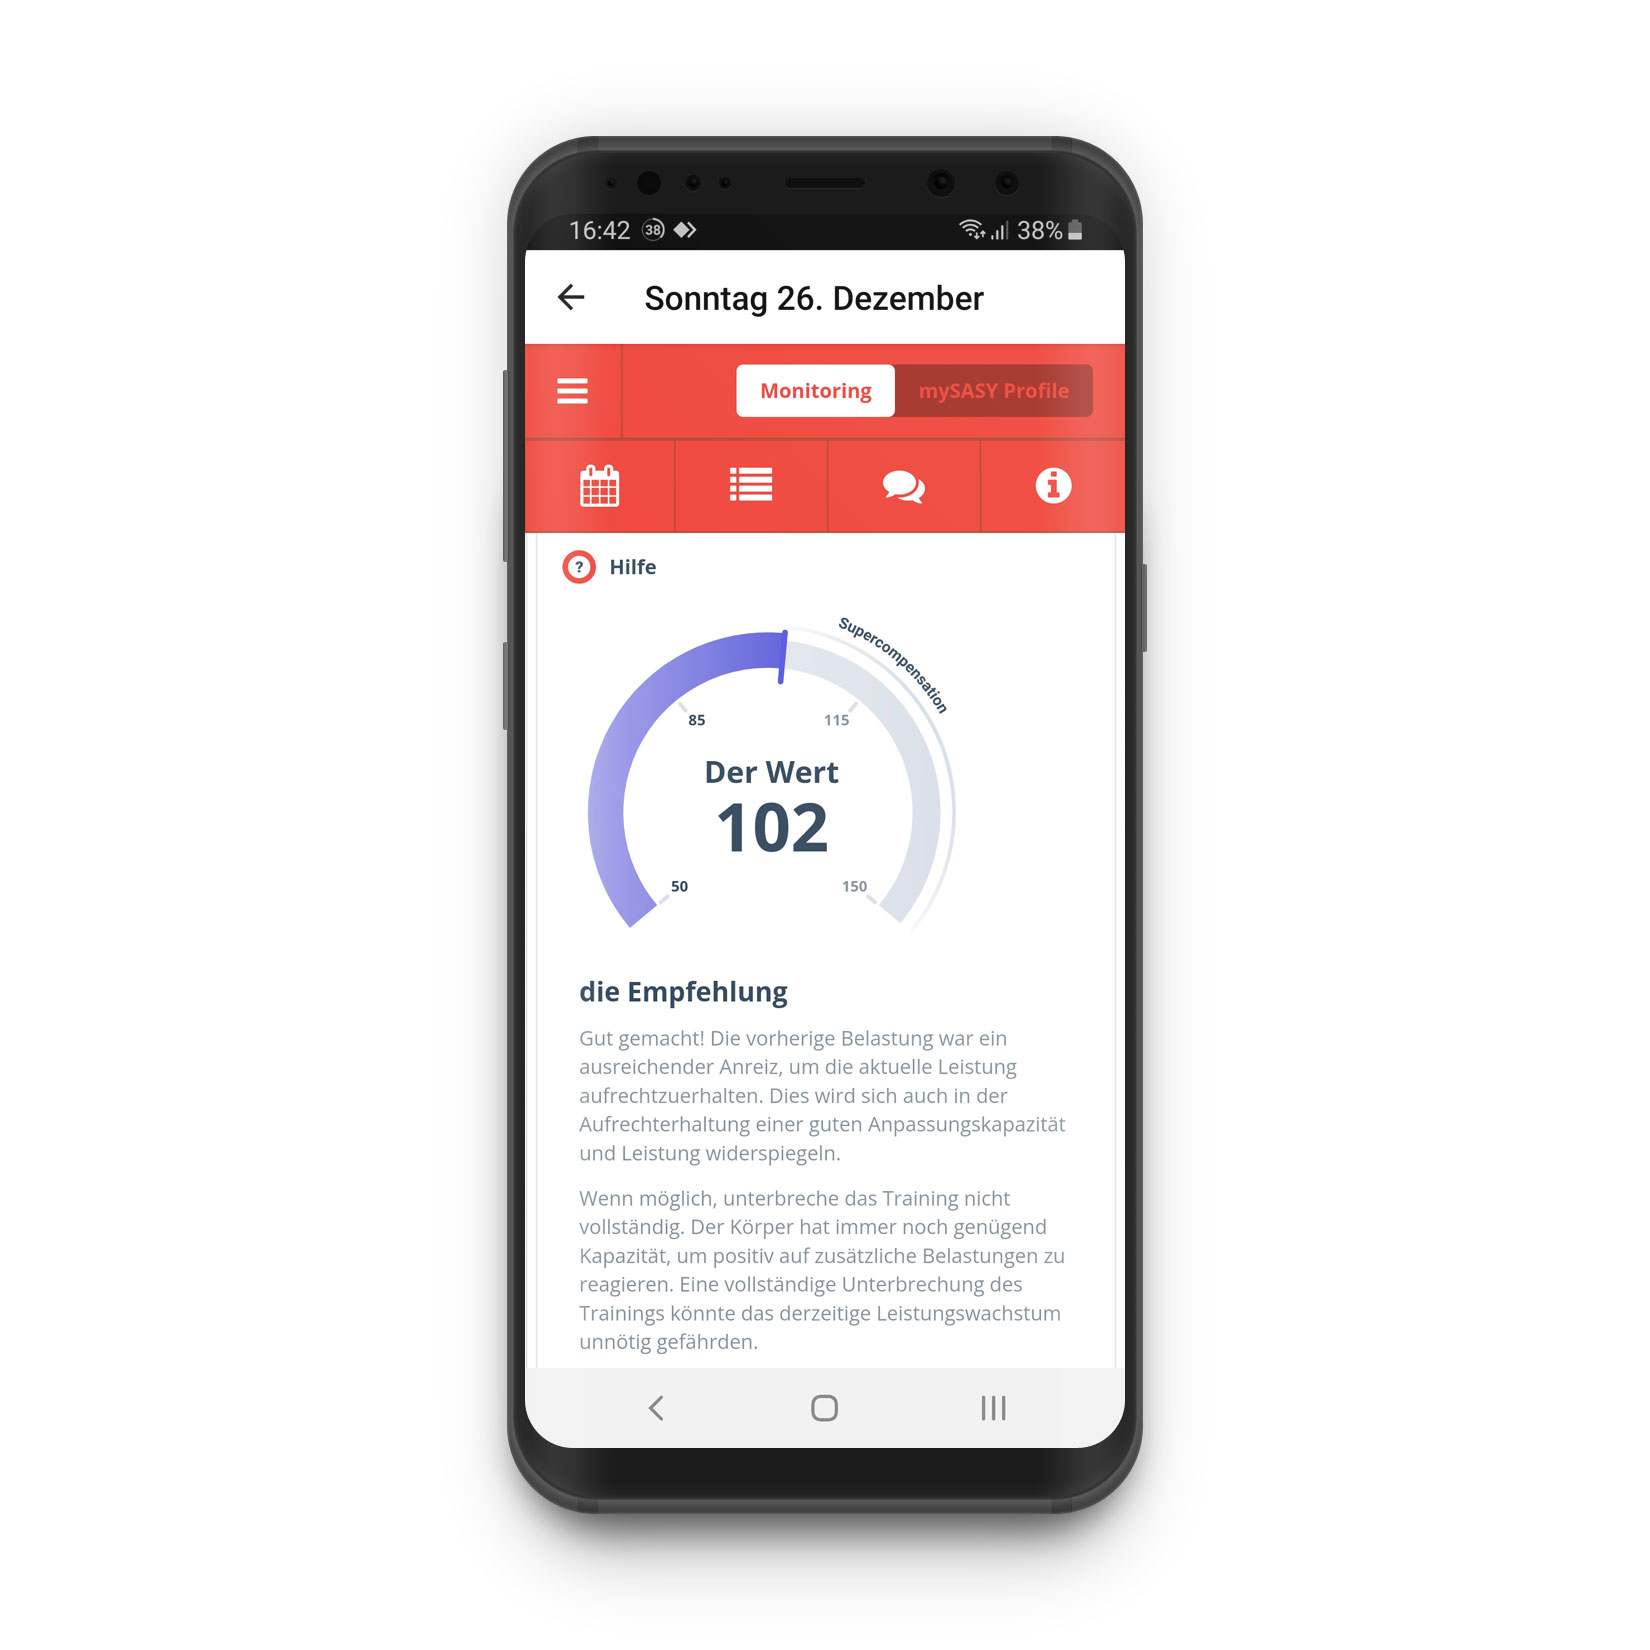
After only six days of measurement and training, the compensation value is given for the first time. It is supposedly based on an extensive comparison of the current measurement with the previous ones and should provide information at a glance about which phase of compensation the body is currently in.
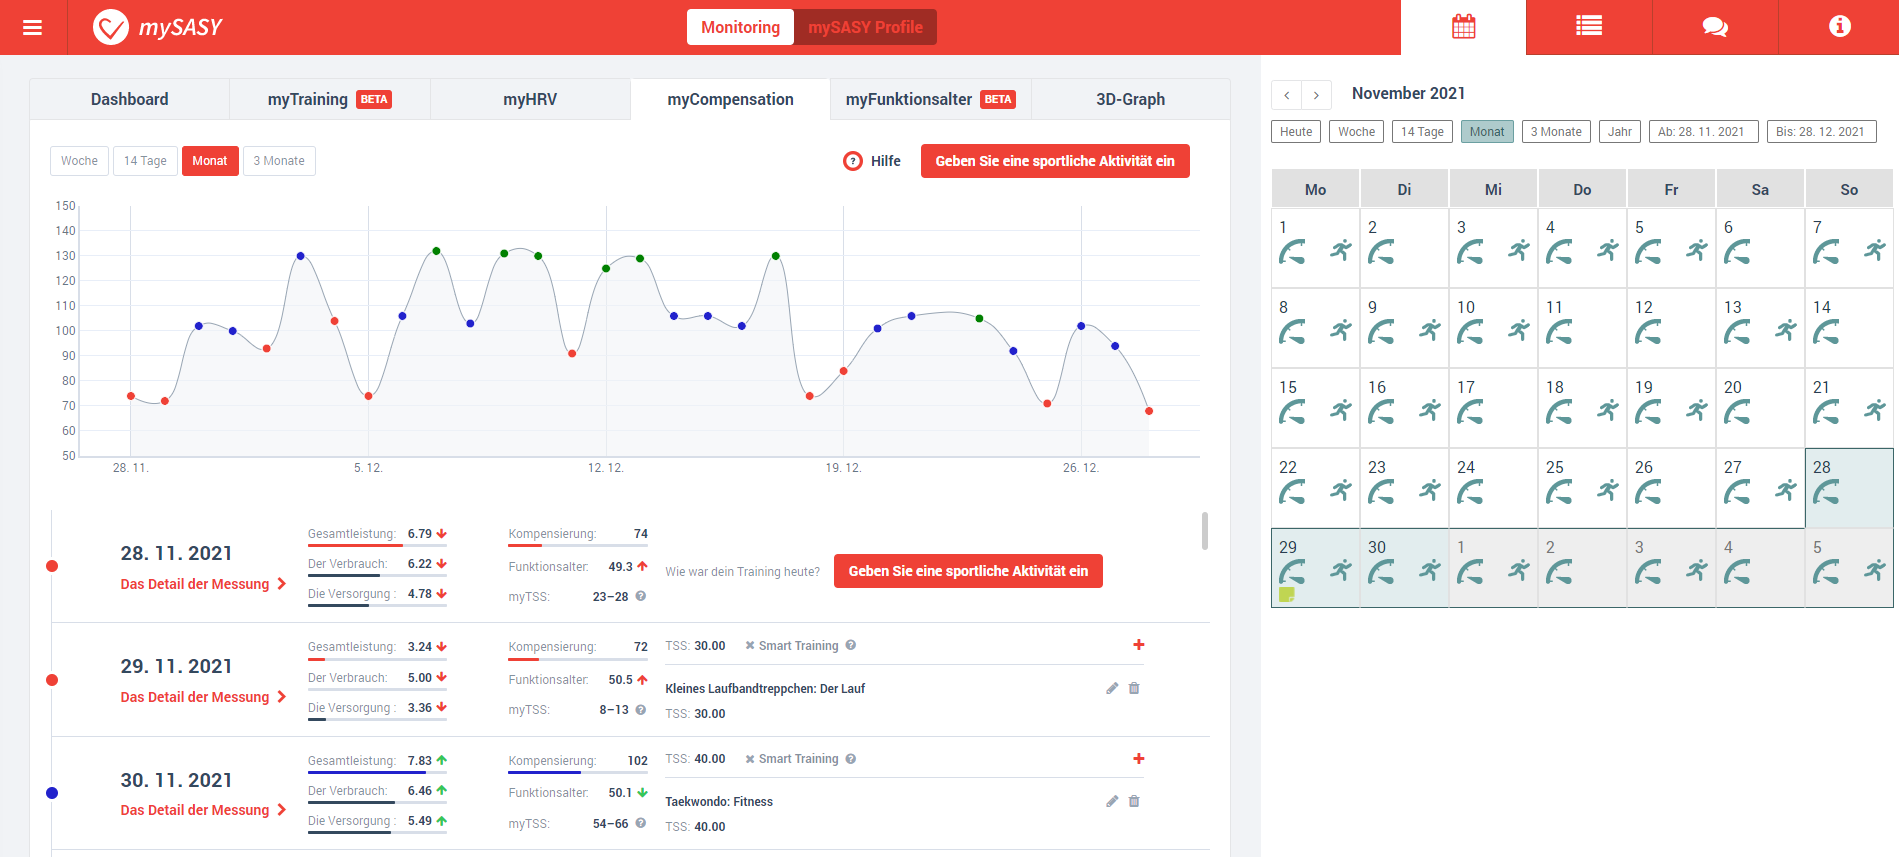
Values in red (50-95%) indicate less than optimal adaptation reactions. This probably means that the training is not challenging enough. In the blue range (95-115%), the body’s adaptation reactions are ideally suited to the training performed, while the green range (115-150%) indicates supercompensation – i.e. the readiness to process higher training stimuli.
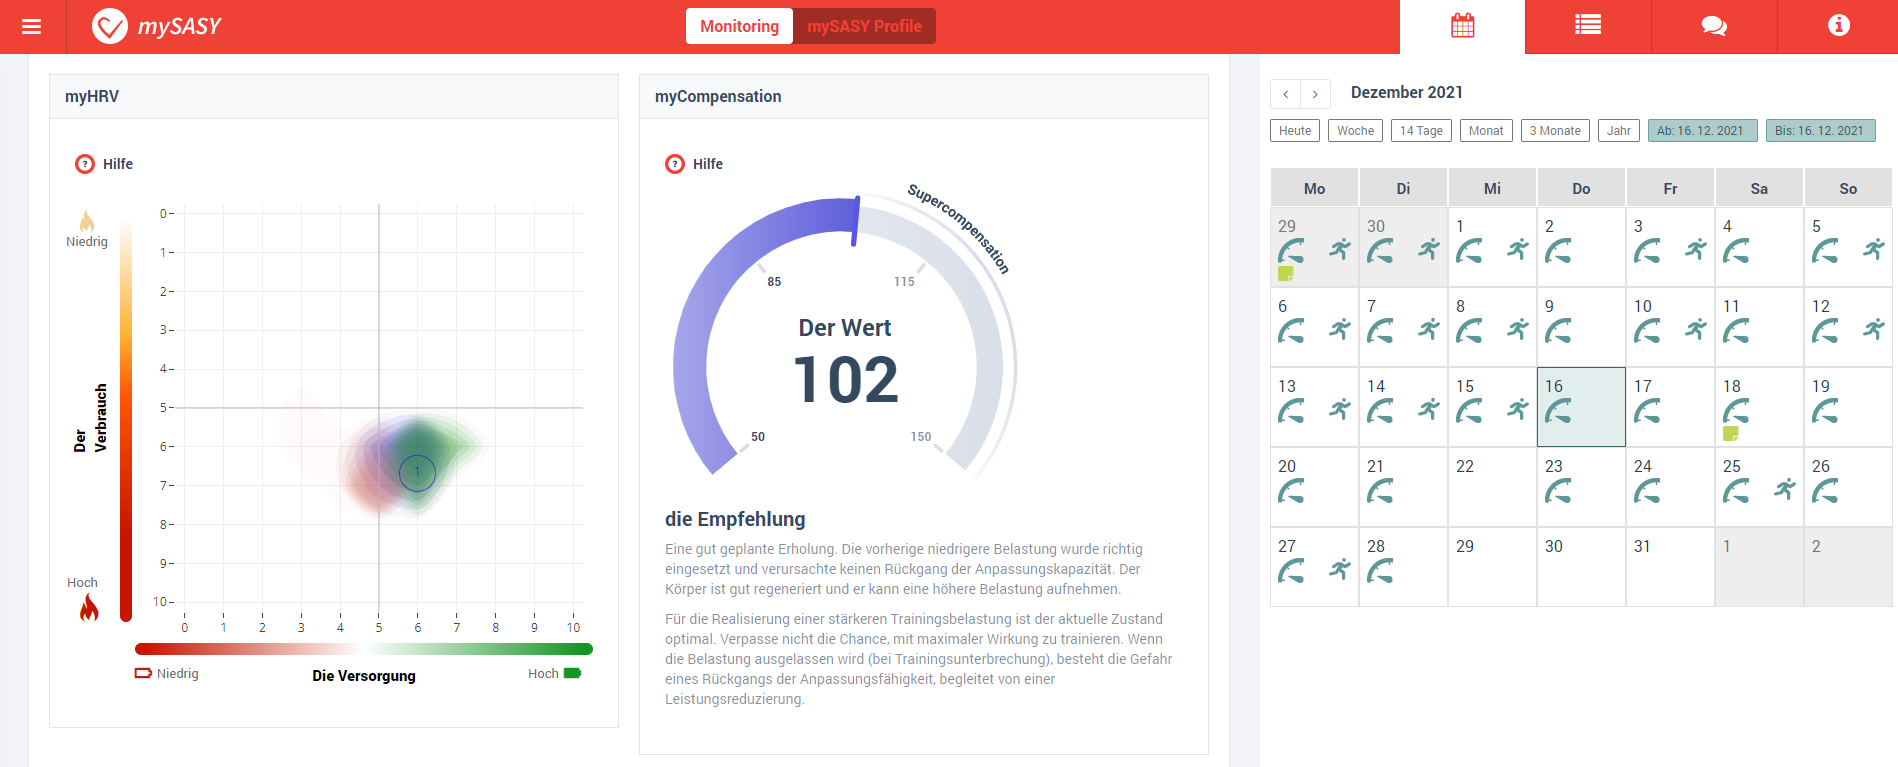
In addition to the numerical value, there is also a textual assessment that often provides helpful information. This is where the entries made by the questionnaire after the measurement come into play, on which the texts created (by algorithm) are based.
In practice
I was surprised how often I found the generic texts helpful! Almost always, the hints they contain have been really helpful in understanding better what is going on. I have been able to learn new things about myself and my adaptation mechanisms to training. The compensation value alone certainly accounts for 80-90% of the benefit of mySASY for me.
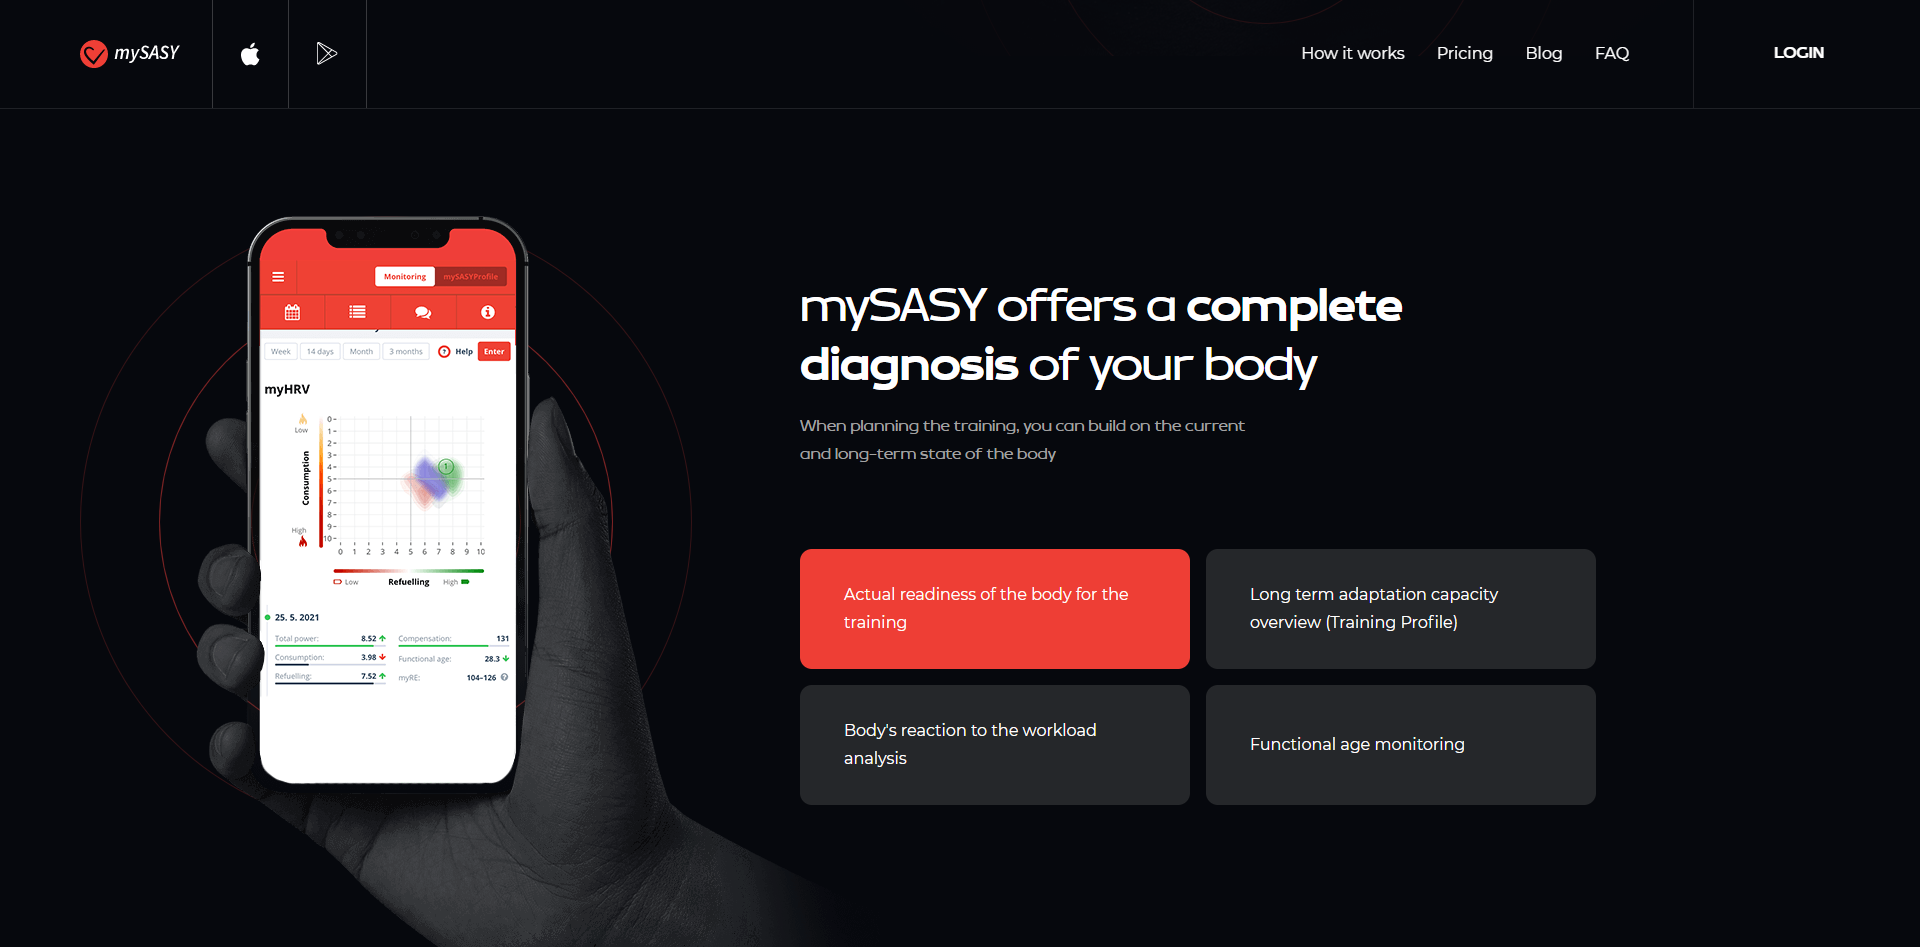
myHRV
Of course, mySASY does not stop at that one overview value. In the “myHRV” section, you can follow very clearly how the measurement points in the two dimensions of the autonomic nervous system change from day to day.
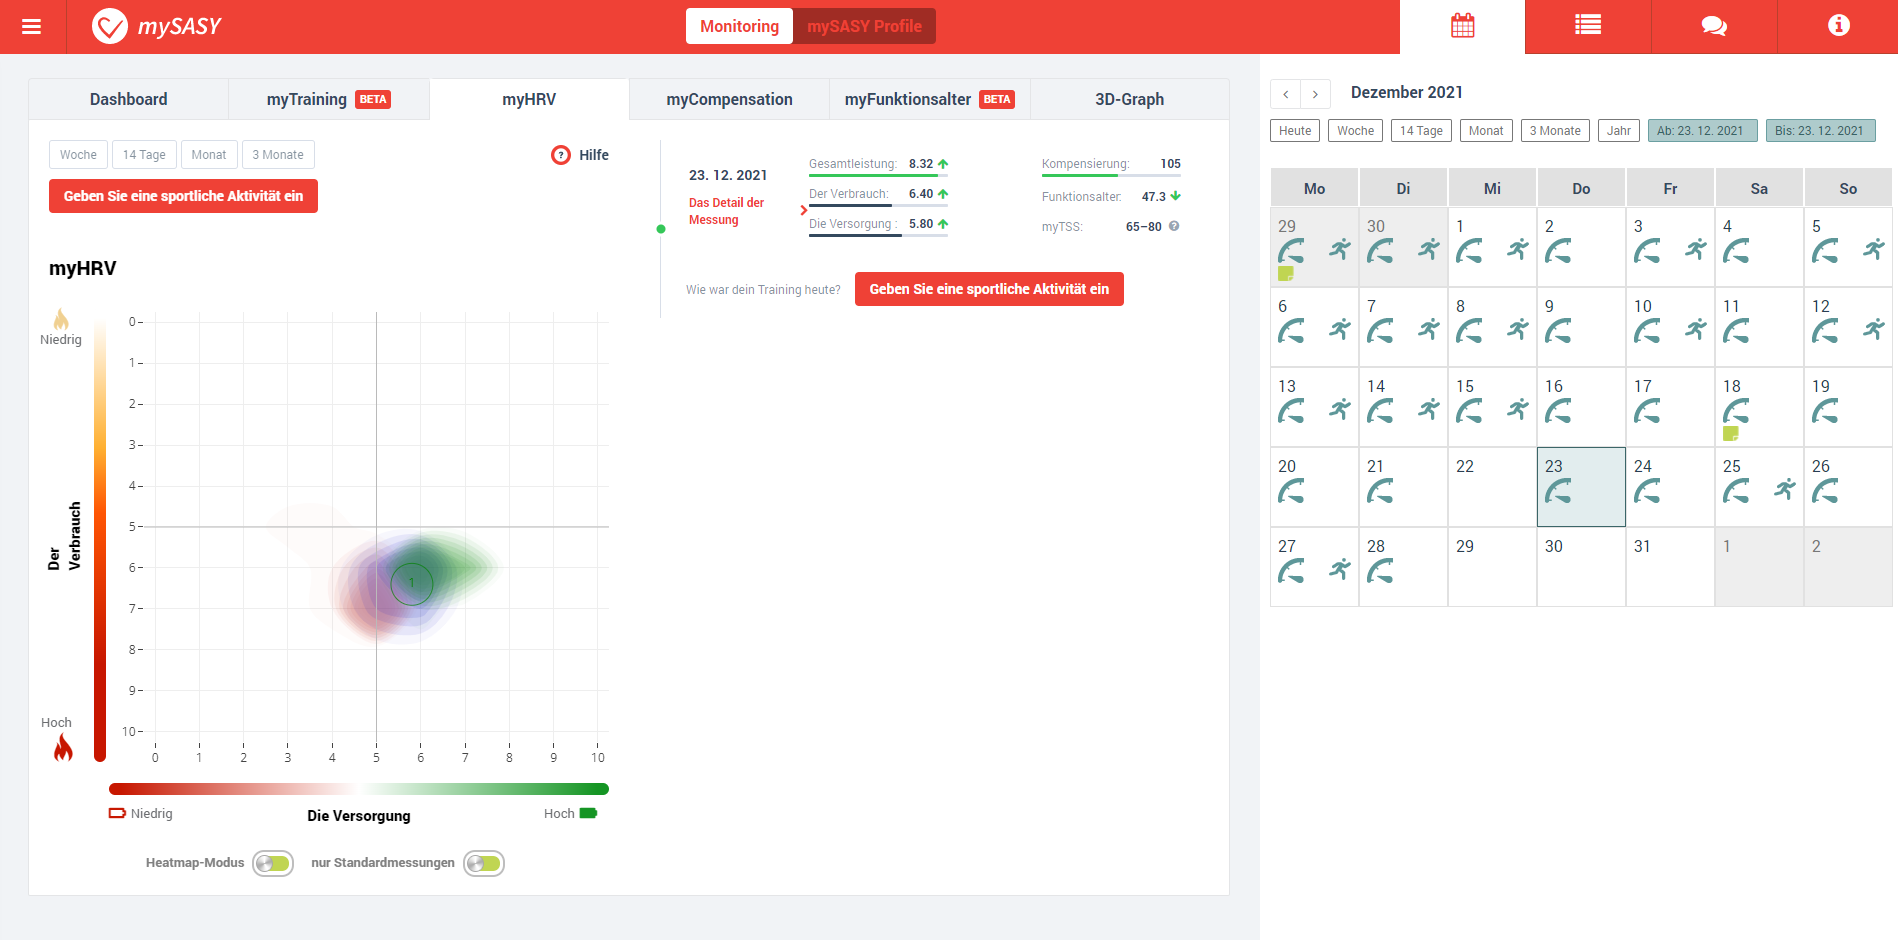
The X-axis of the diagram stands for the part of the parasympathetic nervous system – here called “refueling”. So the further to the right a measuring point is, the more the body is busy replenishing resources.
The Y-axis stands for the sympathetic nervous system. mySASY calls this part ” consumption”. This means the proportion of the systems that are responsible for activating and providing resources.
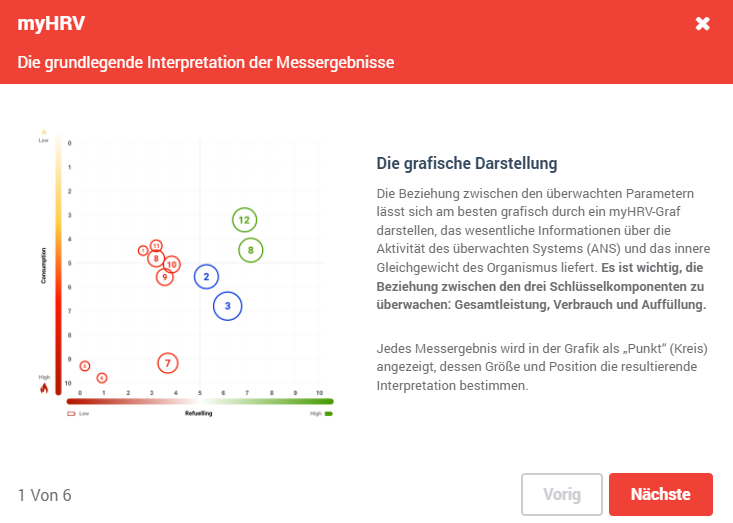
Strictly speaking, however, the graph is condensed even further. This is because the size of the circles shown additionally provides information about the “overall performance”, while the colour stands for the three areas of compensation (see above).
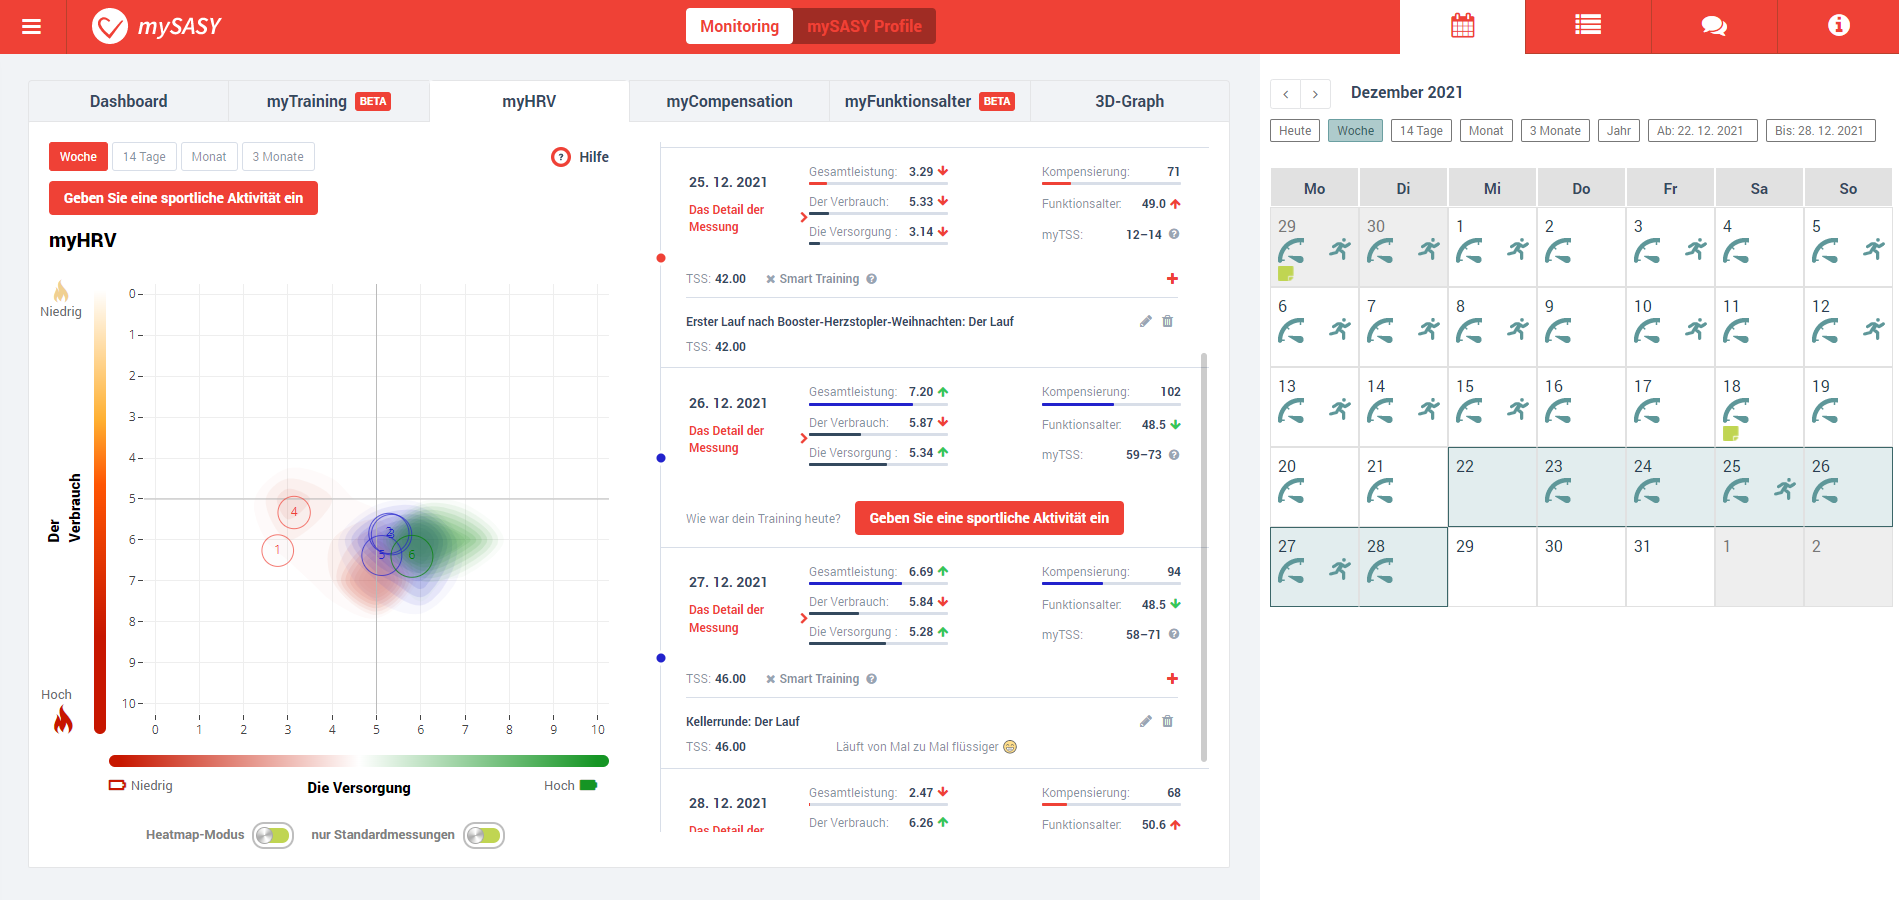
All values can also be read numerically in the number band if you need more precise information than the graphical representation.
In practice
I have to admit that at the beginning I had problems familiarising myself with the terms and the systematic. In addition, the German translations are not always optimal and I therefore partly worked with the English language version. But I have worked my way in (also thanks to one of the brains behind mySASY) and am always impressed by the possibilities of interpretation.
In my case, for example, you can see that the values move mainly on the X-axis and hardly at all on the Y-axis. Actually, one should expect the cloud of points to spread in the direction of right-up and left-down. After all, if the parasympathetic nervous system is active, the sympathetic nervous system should not be so active – and vice versa. My rather horizontal cloud indicates that my adaptation to the training stimuli at the moment is mainly via recovery.
mySASY Profiles
Analysing tens of thousands of measurements, mySASY has identified four basic types in relation to training adaptation: Talent, Holder, Classic and Threat. Each profile has its own characteristics and consequent recommendation for training adaptation.
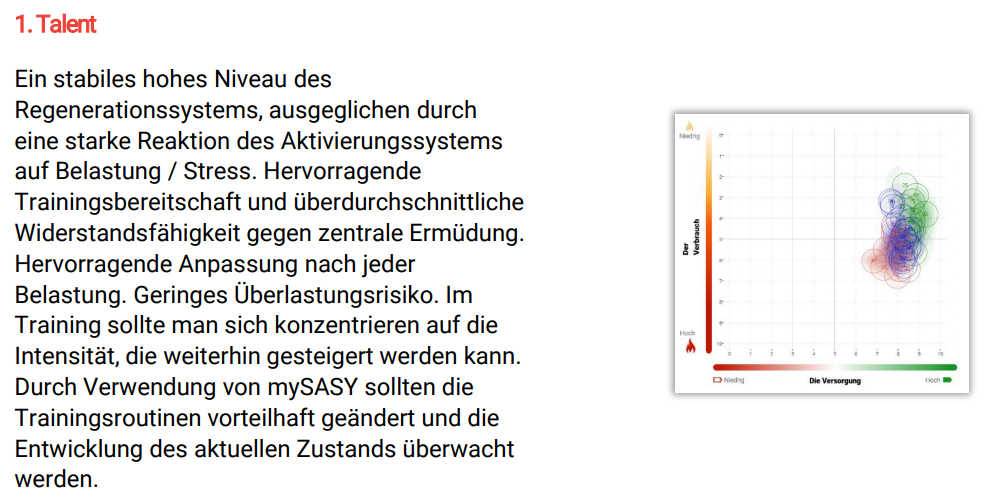
The “talent”, for example, has a high resistance to fatigue and reacts strongly to training stimuli via the sympathetic nervous system. mySASY can help to optimally identify the necessary intensive training stimuli.

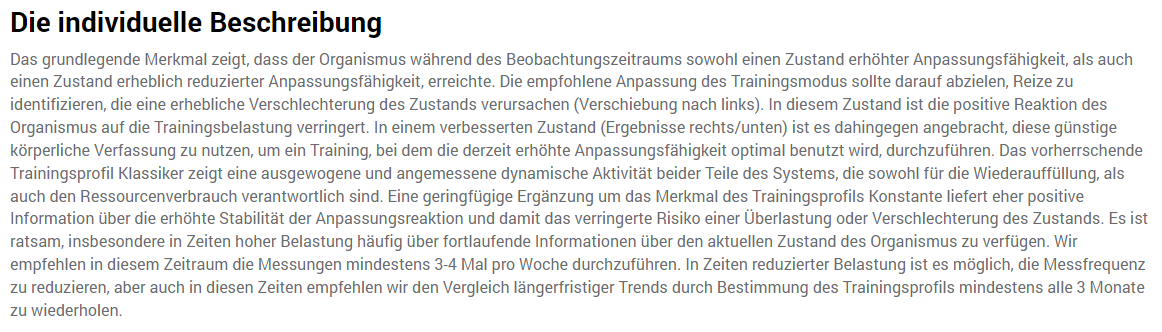
With the “classic”, on the other hand, both parts of the autonomic nervous system react very dynamically to the stimuli. Here, mySASY can help to increase the load in such a way that overload does not occur.
You can have your current profile determined at any time. It is available after eight standard measurements, but is not necessarily always clearly assignable to one of the basic types. mySASY expresses the proportions in percent and always provides an adapted written description that contains specific tips that can be implemented.
In practice
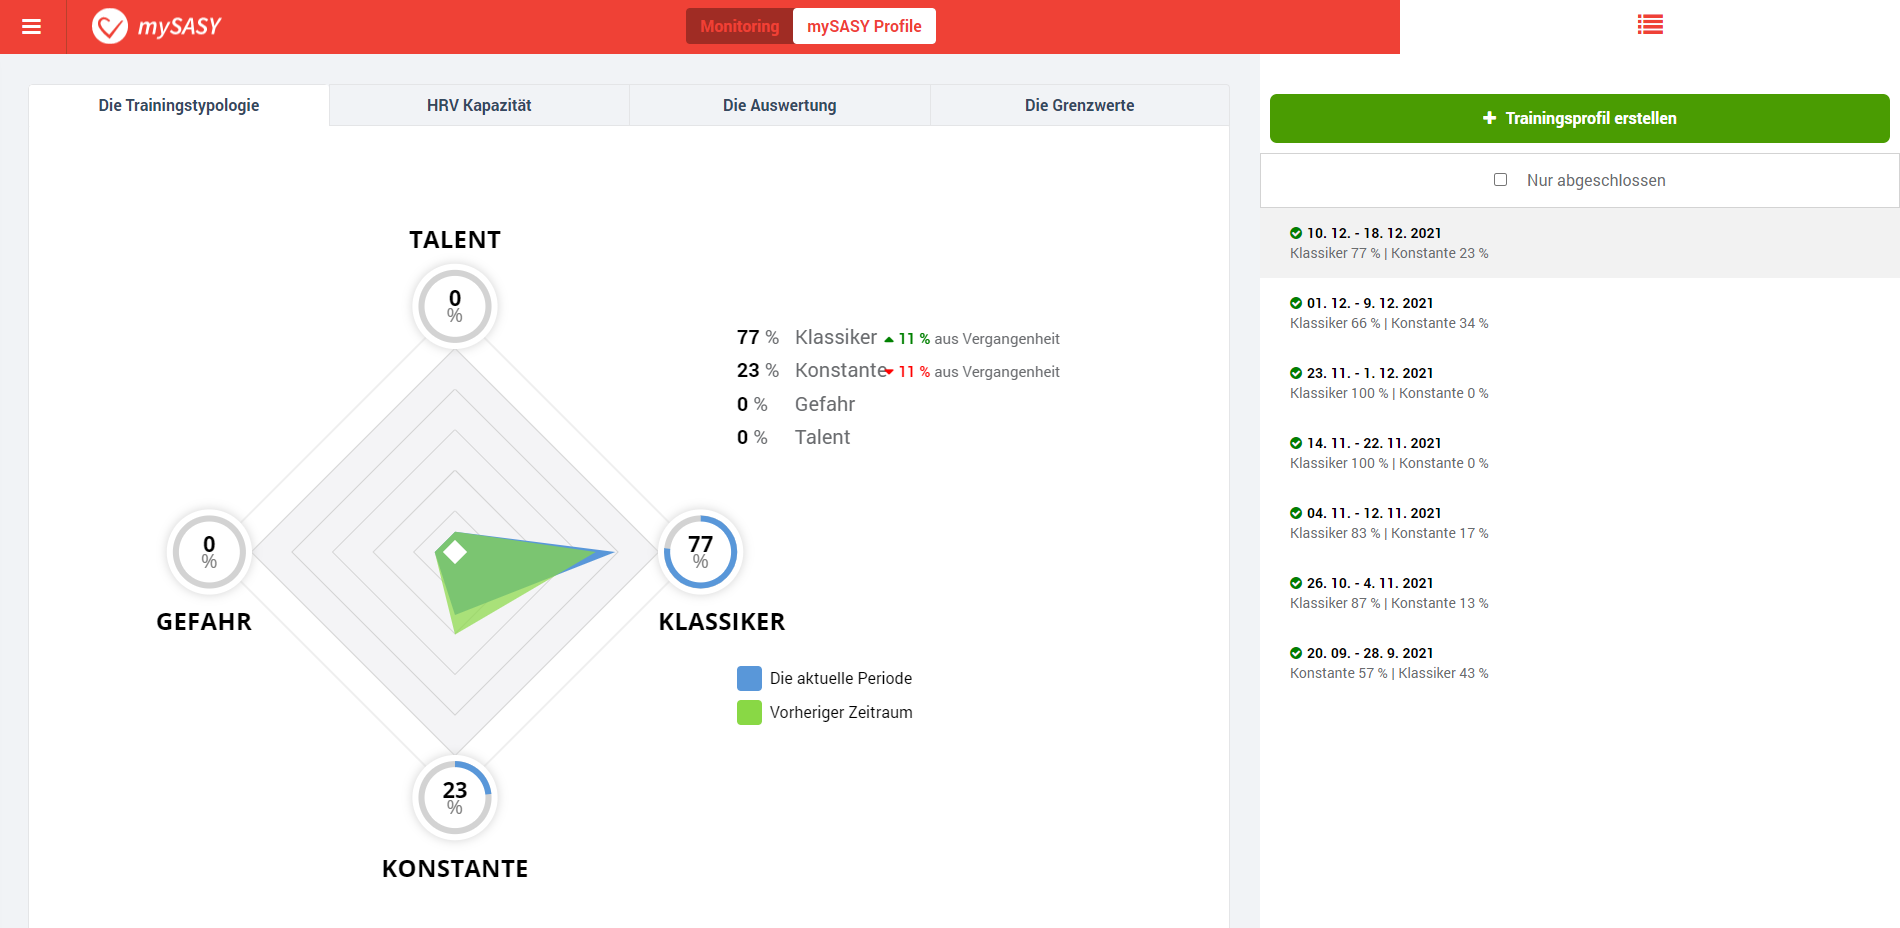
In my last training profile (77% classic and 23% holder) there were obviously days with a clear left shift of the measured values, which I should avoid according to the description. A brief analysis of my measurements quickly showed that this phenomenon occurs every now and then. Namely, exactly whenever I take a two-day break between training sessions!
Even a small load on the second day can prevent the poor training adaptation that would otherwise follow, as I quickly found out. What sounds like only a small insight is the exact opposite for me. Because five years of HRV measurement have so far not been able to show me the negative influence of two rest days on my training adaptation! And even with this knowledge, I cannot detect the phenomenon in my HRV test series…
This “little insight” is very easy to put into practice and (this is what my first experiences show) really makes a noticeable difference in my readiness to train.
myTraining BETA
The “myTraining” module is still in the beta phase, but it already shows where the promising ideas behind it will lead. Here, the HRV data is combined with the training load to generate recommendations for the next training day. The system learns independently in the background and is supposed to keep improving the accuracy of its recommendations.
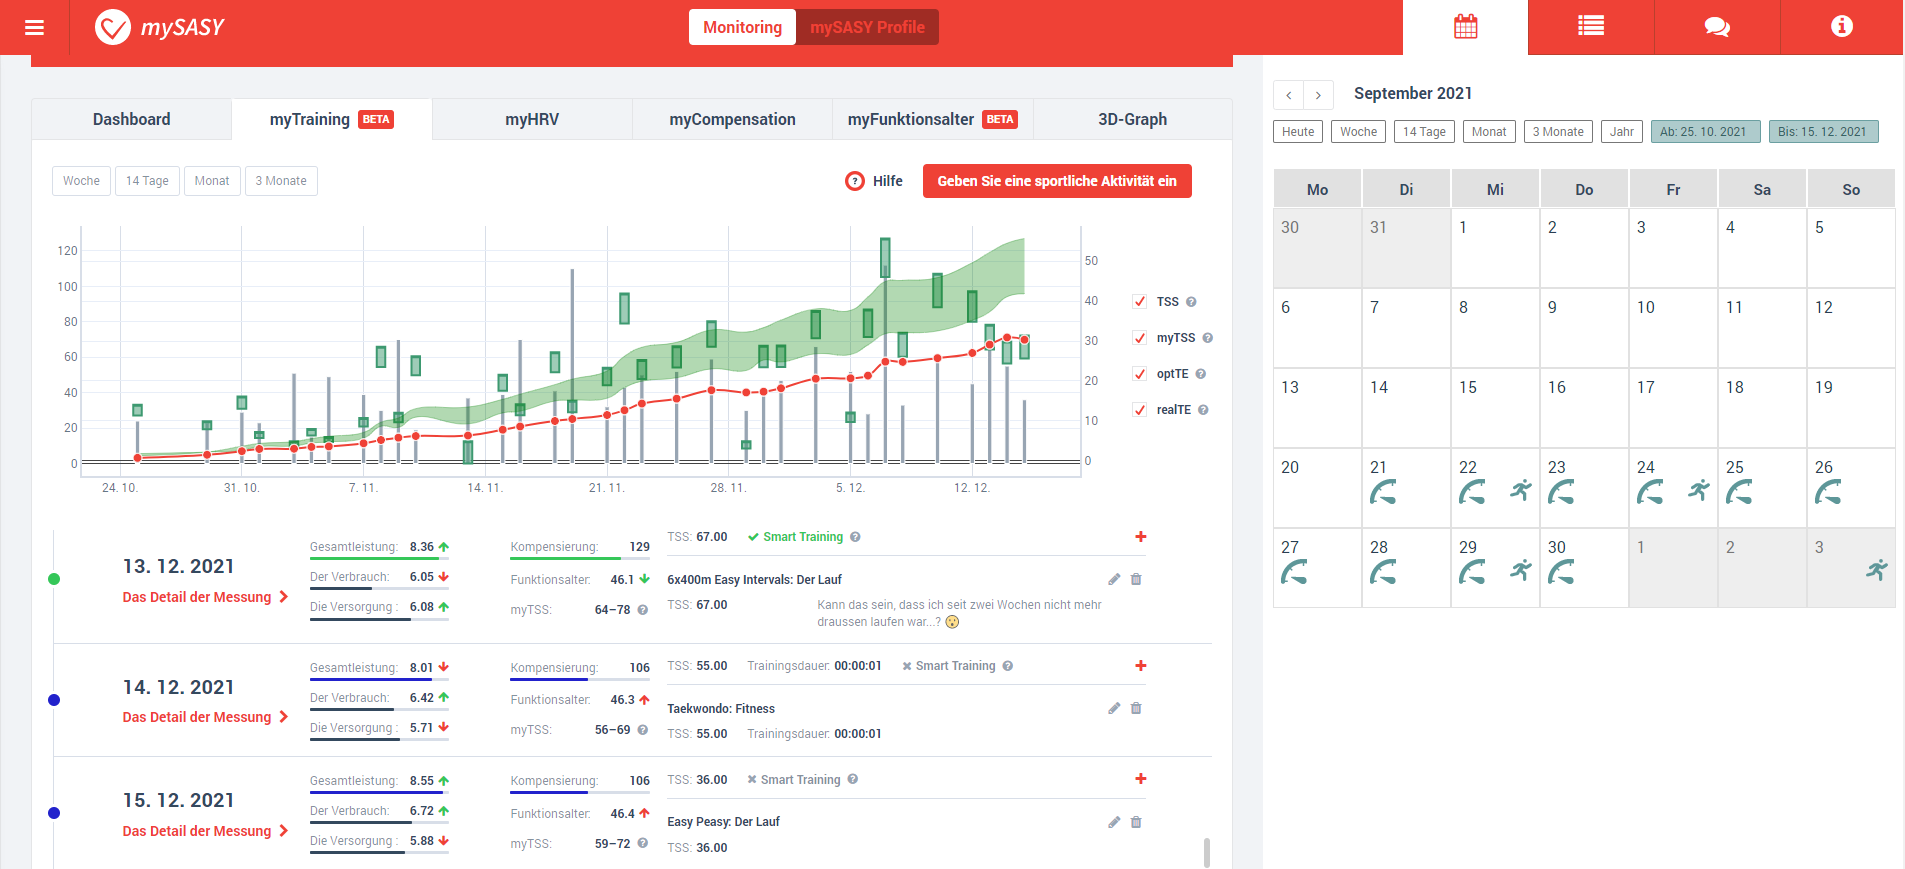
In the graph, the (theoretical) optimal training effect (green area) is compared with the training effect actually achieved (red line). If you always follow the system’s guidelines, the red curve should lie in the middle of the green area. That’s the theory…
In practice
With my current limited training, it was impossible to always meet the targets. Loads with a TSS of around 100 are simply not on the programme at the moment, so it was clear from the outset that there would not be an optimal adaptation in terms of the module.
At the same time, however, I could observe that the recommendations had already settled at currently realistic values after 2-3 weeks of regular training. I could definitely work with this as a rough guide, but I would also miss the “intensity” factor.
myFunctional Age BETA
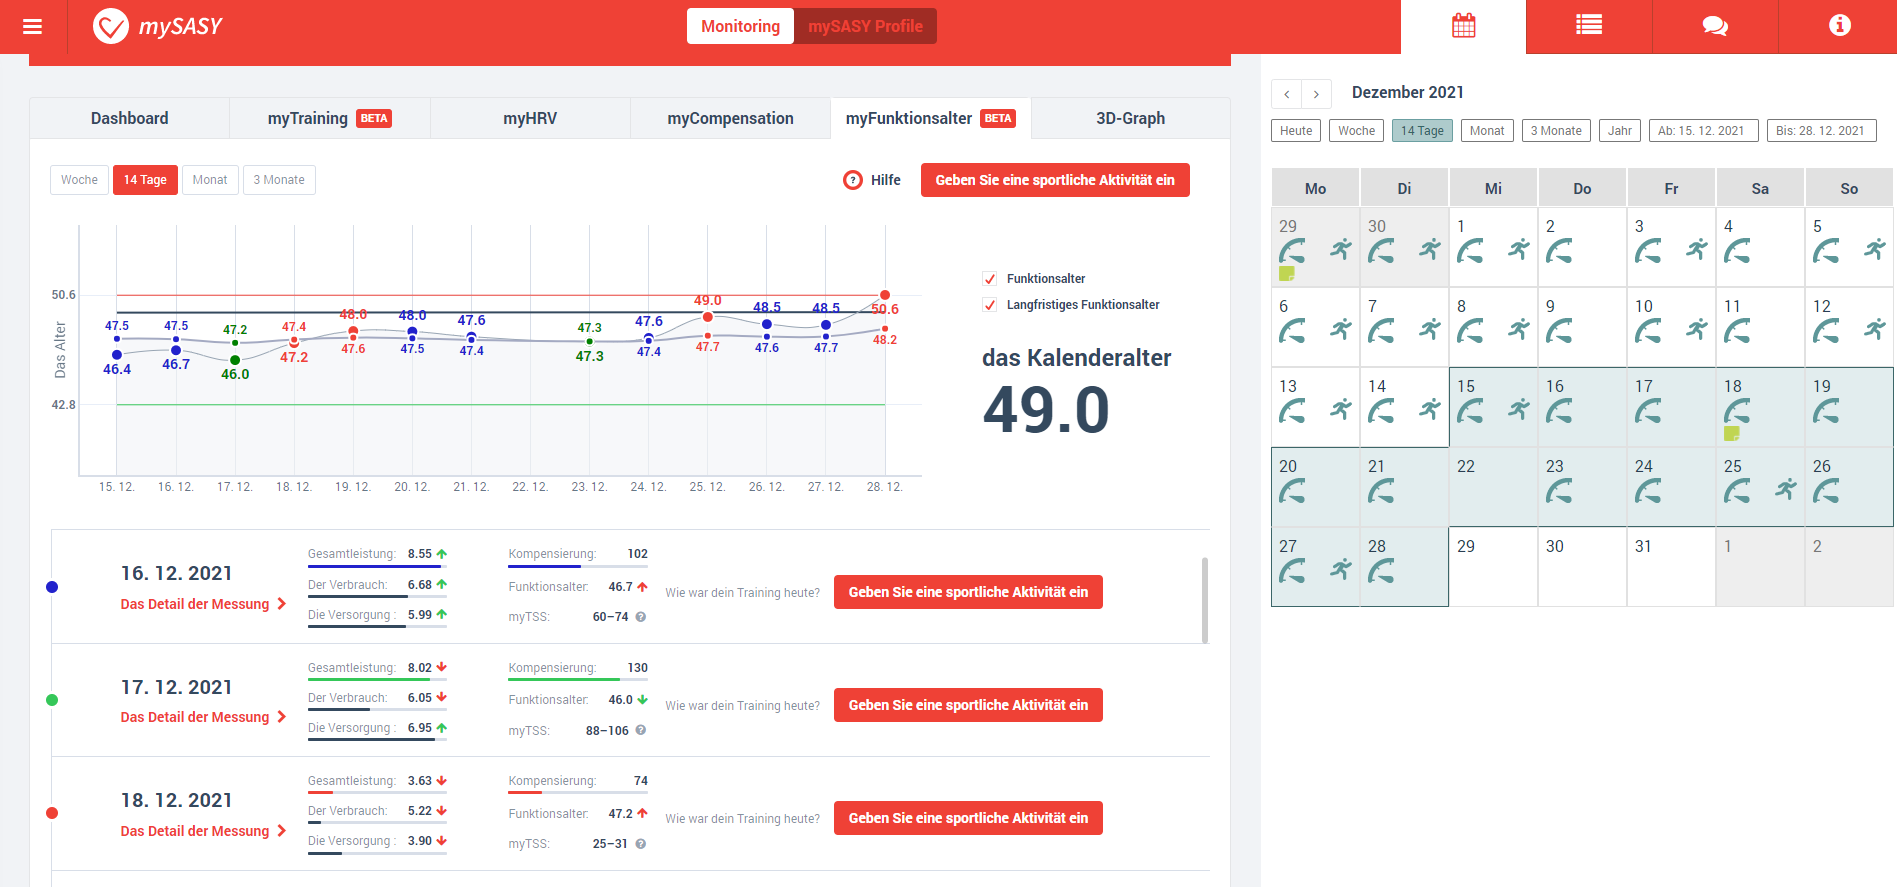
The module “myFunctional Age” is also still in beta. According to mySASY, the functional age corresponds to the body’s ability to withstand training loads, stress and impulses from the external environment and general health. By comparing it to your calendar age, you can see whether you are above or below average (compared to your peers) in dealing with training stress.
In practice
The development of the functional age roughly follows the movement of the training condition, I would say. However, the relevance of this value for my training has not yet become clear to me.
Comparison with other systems
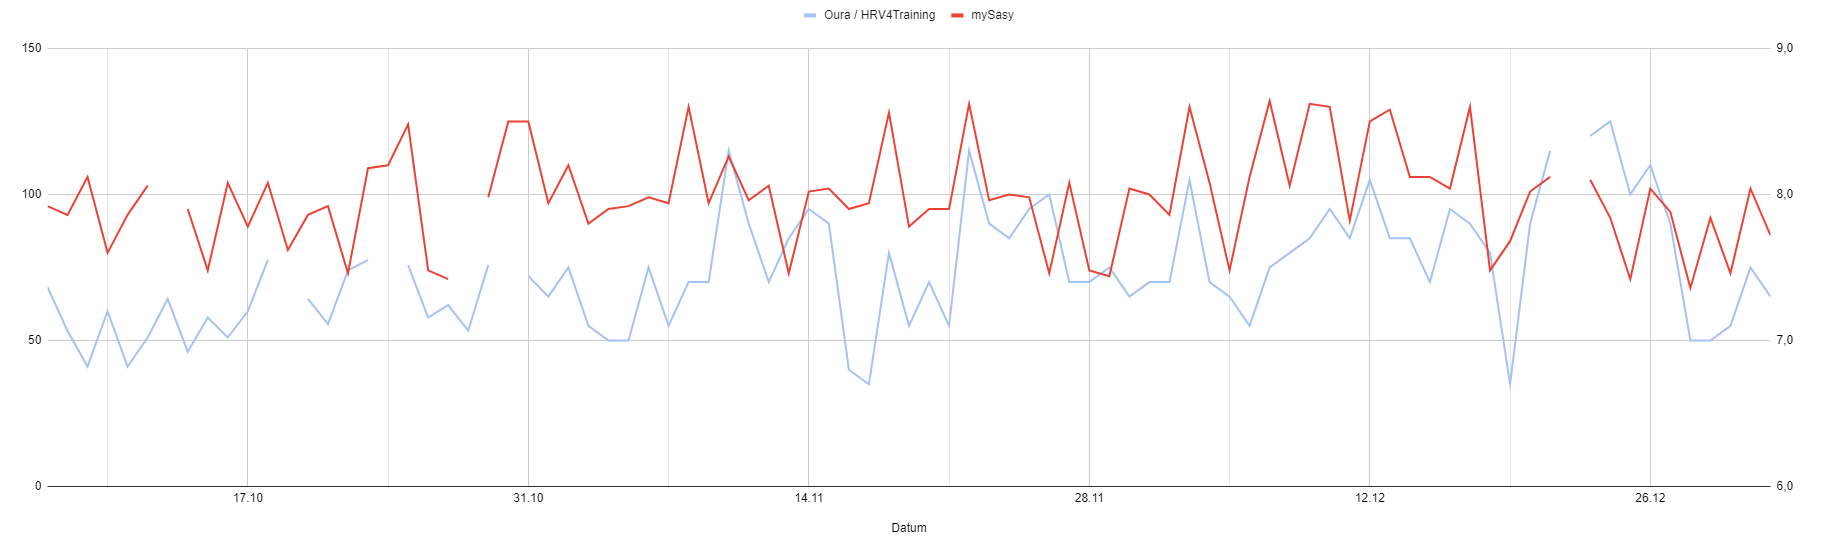
From my experience with different HRV systems, HRV4Training has emerged as my standard. I have been collecting data with it for a very long time and can assess the values very well for myself. Both systems were relatively consistent over my comparison period (especially in the green marked area). But there were also clear deviations (red).
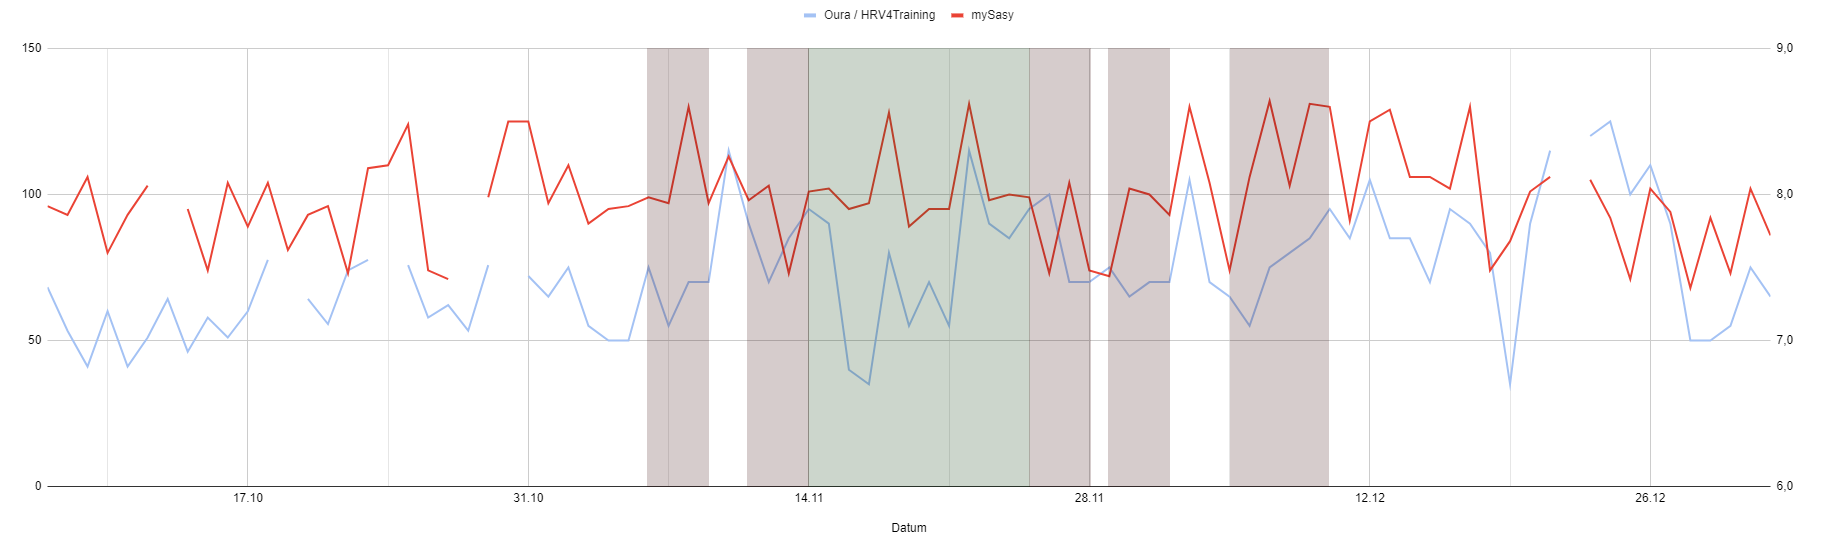
Often mySASY then sees potential for further training adaptations, while HRV4Training would already slow me down or at least not encourage me further. Normally I would have taken a rest day, but I went running after the mySASY recommendation. Sometimes only easy for half an hour, but on really green days there were also unplanned intervals.
Right now, I’m not in a training plan with high volumes and intensities, so the significance is certainly somewhat limited. But I always had the feeling that it was good to follow mySASY on such days. Especially the easy half hour on the treadmill I would never have done normally. Especially not when the HRV4Training value was calling for a break. But in the end it was always the case that things went uphill the next day.
Criticism
Unfortunately, with mySASY there is not only sunshine, but also shadow. For example, it took me some time to get used to using the web client. The functionality is certainly there, but the handling could be more intuitive.
This also applies in part to the app. Because strictly speaking, only the dashboard and measurement are part of the app – for everything else, a mobile version of the web client is used. And that is anything but optimal.
Then I must also say quite clearly: the German translation is not good. Incomprehensible sentences appear (albeit rarely), the meaning of which only became clear to me when I switched to English. If you overlook this and a few linguistic blunders, mySASY is completely usable in German. But I expect more from a paid service. On the other hand, this point can be turned off relatively quickly if you (i.e. mySASY) want to.
Another point of criticism is already in the works in the background: synchronisation with other services. For the myTraining function, you can currently only pair with Strava. Those who (like me) prefer to work with the TSS system from TrainingPeaks have to enter the values manually. In addition to the import from TrainingPeaks, I would also miss an export there. I could really use the daily compensation value there.
More sources of information
I have not yet found any other reviews of mySASY. But if you want to delve deeper into the matter, you can draw from the manufacturer’s wide range of offerings. There is a blog, a FAQ and an mySASY-Academy.
I also like this video from the mySASY YouTube channel. Here Pavel gives really deep and helpful insights into the system, its usage and the science behind it.
Last but not least, there is also a quite extensive user manual, which is a good way to familiarise yourself with the app and all the values obtained, and a long literature list.
Conclusion
mySASY is a game changer that is definitely worth 5 euros a month for me. The knowledge gained by measuring both branches of the autonomic nervous system is so huge that I couldn’t be happy with any of the other systems again. And I say that after five years of daily HRV measurement…
Despite the enthusiasm, mySASY is far from perfect. The German translation should be at the top of the to-do list – closely followed by the integration of other platforms such as TrainingPeaks. But that would only be the cherries on top of the cream ;) The major value added of the platform is already there. And this is due to a technology that is probably unique at the moment and that I wouldn’t expect to see from any of the other providers so soon.

Autor und Betreiber von Harlerunner.de. Läufer seit mehr als zehn Jahren, über 100 Wettkämpfe von 5 km bis Halbmarathon im Gepäck, bisher mehr als 500 Produkte getestet. Kein Labortest — alles kommt aus dem echten Training in und um Coesfeld. Was du hier liest, hat er selbst an den Füßen, am Körper, am Handgelenk oder im Ohr gehabt.
Author and owner of Harlerunner.de. A runner for over ten years, with more than 100 races under his belt – ranging from 5 km to half-marathons – and having tested over 500 products to date. No lab tests – everything is based on real-world training in and around Coesfeld. Everything you read here is something he has personally worn on his feet, on his body, on his wrist or in his ear.